


How to Dominate Your Fantasy Football Superflex Leagues


This isn't how it used to be.
In today's fantasy football world, waiting to draft a quarterback is commonplace. You probably do it. Your friends do it. Everyone does it.
In 2012, that wasn't the case.
This isn't how it used to be.
Just six years ago, five quarterbacks were being selected in the first round and a half of fantasy football drafts. Yes, that's for real. The 12th quarterback that season, Jay Cutler, was falling off draft boards in the seventh round.
Your leaguemates might laugh at you for drafting a non-elite passer in the seventh round these days.
Sometimes I think I got lucky by publishing an e-book titled The Late-Round Quarterback after the 2011 season, right before the big quarterback average draft position spike. But then I quickly remember that there's math and logic behind drafting your quarterback late in fantasy football. It really wasn't a situation of fortune as much as it was a situation of market exploitation.
Because of the way quarterbacks are viewed in fantasy football now, superflex leagues -- and two-quarterback leagues -- are becoming more and more popular. If you're unfamiliar with the superflex format, it's one that has your typical fantasy football lineup, but there's an additional flex spot where you use a second quarterback. Since passers score the most points in the game, putting one in that lineup slot makes the most sense.
And this completely changes your approach to a fantasy football draft.
Understanding the Late-Round Quarterback Approach
The only way to grasp why your draft strategy alters in a superflex league is first to understand the value of a quarterback in the standard single-passer format. Without a comparison, you can't fully comprehend the change.
The late-round quarterback strategy essentially breaks down into four main concepts: supply and demand, opportunity cost, predictability, and scoring variance. Let's dig into these ideas, one by one, without feeling like we're in a boring college lecture.
Supply and Demand
I was born in the '80s and spent my childhood in the '90s, so my hobbies growing up included playing with Pogs, collecting Pokémon cards, and resetting people's Tamagotchis because I was a horrible human being.
I also played a lot of street hockey. And, oftentimes, I'd play goalie. Not always by choice, though.
You see, I've got an older brother who had friends in the neighborhood that were his age. They'd always be out on the cul-de-sac playing hockey, but they rarely had a netminder because, let's be honest, kids growing up in Pittsburgh wanted to be Mario Lemieux, not Tom Barrasso.
That was my chance to play with the big kids. And it was also the first time I realized what supply and demand was all about. They needed a goalie, and I was the only one willing to play goalie. There was a high demand with little supply.
The reason you can get viable quarterbacks late in your fantasy football drafts is because of this supply and demand notion. In a competitive market -- and we're keeping things very simple here -- when the demand increases, the supply decreases. And the opposite holds true, too.
In your fantasy football league, this "demand" is dictated by the number of players needed to fulfill your lineup's requirements. You need two or three wide receivers and running backs, but you only need one quarterback.
In turn, quarterback pricing drops.
| Average Overall Pick Since 2011 | |
|---|---|
| QB1 | 13.5 |
| QB6 | 54.3 |
| QB12 | 89.6 |
| RB1 | 2.7 |
| RB12 | 28.7 |
| RB24 | 69.6 |
| WR1 | 5.2 |
| WR12 | 32.1 |
| WR24 | 57.7 |
Over the last seven years, on average, the top quarterback in fantasy drafts has been selected at the beginning of the second round according to MyFantasyLeague.com's average draft position data for PPR leagues. This may seem surprising but, remember, the way we draft quarterbacks today isn't how we used to draft them.
Meanwhile, the top running back and wide receiver have been drafted in the top five, while the 24th player at each position has been selected in the top-70. The 12th quarterback -- the last hypothetical starter in a 12-team league -- has been taken near Pick 90.
Given these starters are being drafted later, that means your opportunity cost in grabbing one early is much greater than at running back and wide receiver.
Opportunity Cost
You go and get ice cream with your family. As you stare at the 86 flavors on the menu board in front of you, you decide that you want some mint chocolate chip because mint chocolate chip is unequivocally the best flavor on the planet.
That decision you just made -- your choice to go with mint chocolate chip -- had an opportunity cost. You bought the mint chocolate chip ice cream, but you forwent the chance to have the other 85 flavors on the menu. You also could've spent that money elsewhere, opting not to have ice cream altogether.
"The loss of potential gain from other alternatives when one alternative is chosen." That's opportunity cost. When you make a choice, you're also not choosing something at the same time.
Think about a snake or auction draft. When you go and select a player in the first round -- or when you spend a lot of money on a player -- the opportunity cost in getting that player is every other player you didn't get. If you draft Le'Veon Bell first overall, you're forgoing the opportunity to have Todd Gurley, Ezekiel Elliott, David Johnson, and so on.
Pretend that the difference in projection between the RB1 to RB24, the WR1 to the WR24, and the QB1 to the QB12 is all the same in an upcoming draft. It's 100 fantasy points, and that point differential from one player to the next is evenly distributed. In other words, the best running back to the worst assumed starter in a 12-team league is giving you no more of an edge compared to the best wide receiver or quarterback to his position's worst starter.

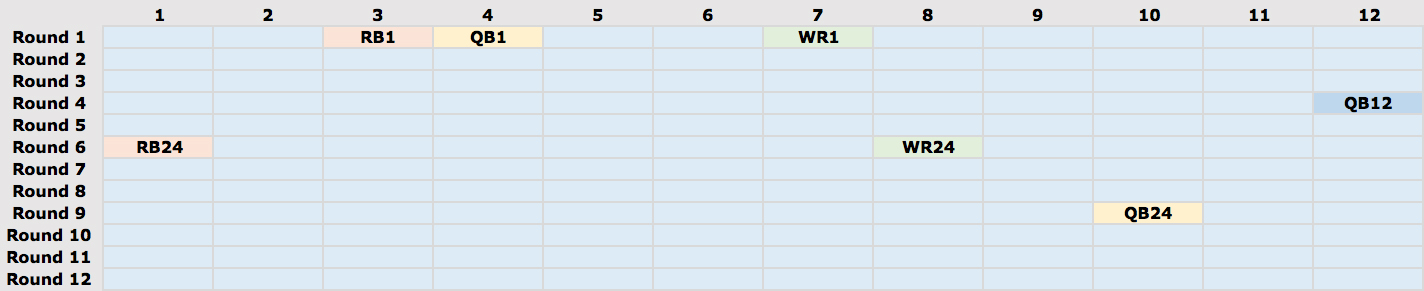
Your opportunity cost, given market value, is much greater when you decide to draft a quarterback early. And the fake draft board above gives you a visualization of this.
If the average RB1 is selected about second overall while the RB24 is dropping off at Pick 70, then there are 68 spots where those 100 points are being spread (1.47 points per pick). At wide receiver, that gap is even smaller (1.89 points per pick). But at quarterback, it's largest (1.33 points per pick). That means with each passing pick, you're gaining the largest points edge in a given round by waiting to draft your quarterback.
This is a super simple way of looking at opportunity cost through market value. In an actual draft, projections won't be so clean, certain positions may be drafted earlier than expected, and, to be honest, the method of strictly looking at projections to determine value over replacement (VORP) -- or what's commonly referred to as Value Based Drafting -- has plenty of flaws.
Yours truly did a quick podcast on these VORP shortcomings last year, so feel free to put my voice in your ears if you want detail on the subject. But if you want the CliffsNotes, the first issue with VORP is that choosing a baseline player for comparison is really inconsistent and tough to do accurately. I used "top-24" above to designate an RB1, RB2, WR1, or WR2 in a standard fantasy lineup, but that's still not a completely objective way to judge value.
Perhaps more importantly, VORP relies too heavily on projections and doesn't account for natural variance. What happens if your projections are really wrong? What about when you're looking only for upside late in drafts? Projections can't help you as much there.
Projections also don't tell you everything about a player. And that plays a key role in the next late-round quarterback concept.
Predictability
There are two ways to think about predictability in fantasy football: at the season-long level and at the weekly level.
A lot of fantasy owners will draft quarterbacks early because of their perceived safety. The thought is that we generally know which quarterbacks will perform well throughout a given season and, therefore, their low rate of busting makes them valuable in the early rounds.
But what if I told you early-round quarterbacks bust at a similar rate as running backs and wide receivers?

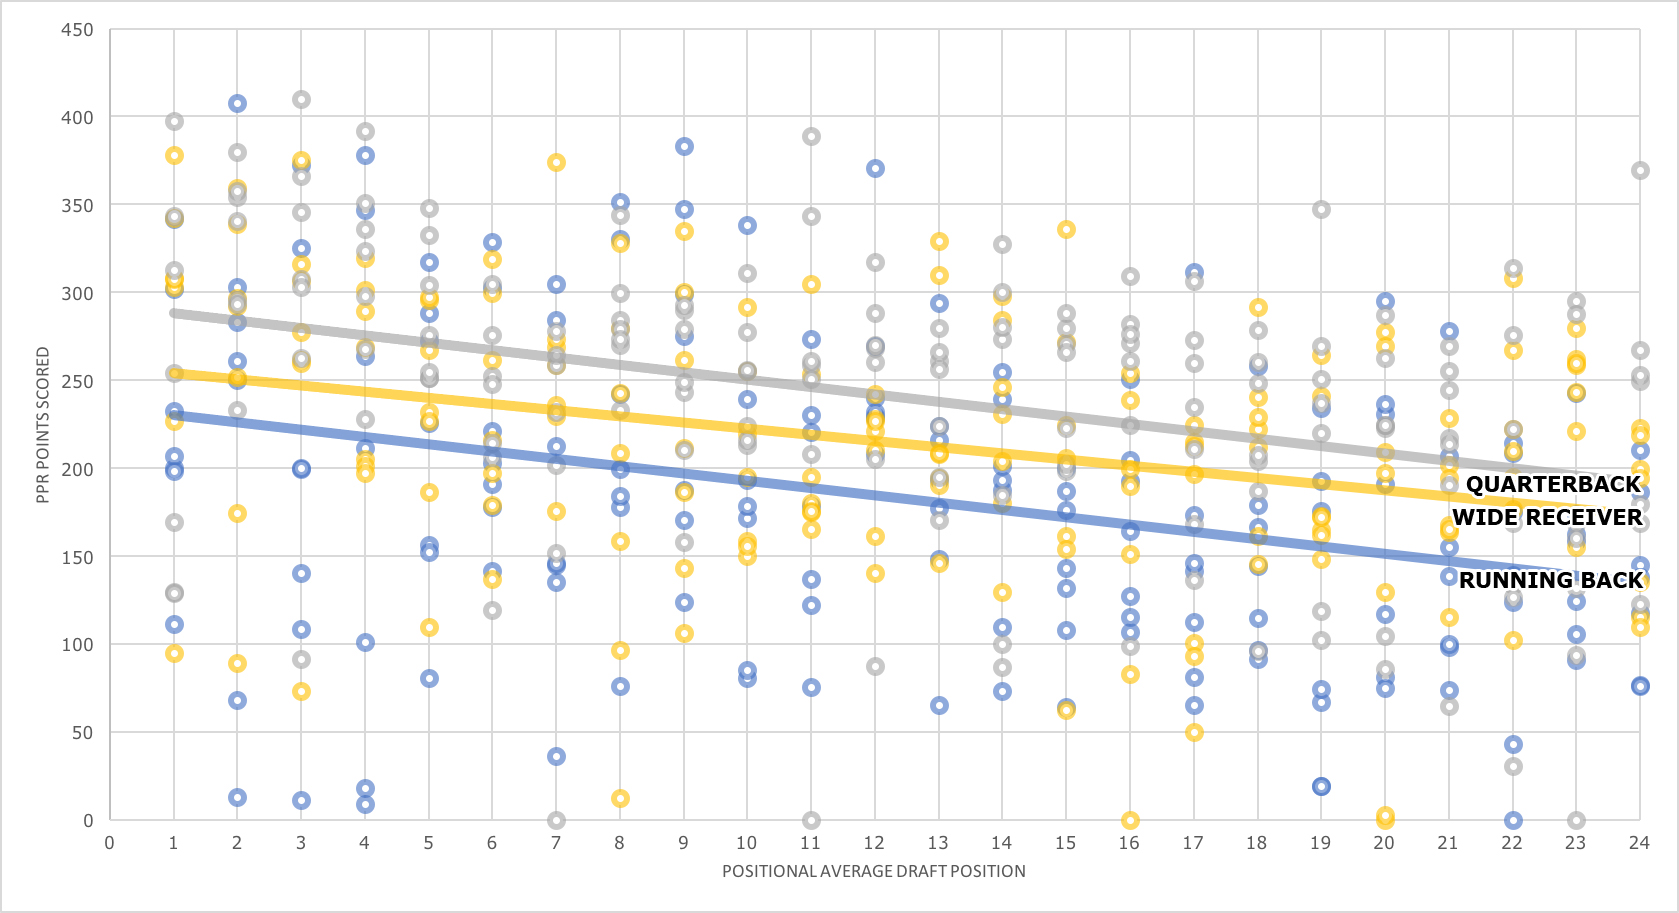
The scatterplot above is showing positional average draft position versus PPR points scored over the last seven seasons. For running back and wide receiver, we're looking at the top-48 at the positions. For quarterbacks, we're looking at the top-24. Arbitrary? Slightly. Logical? I'd say so, as you're starting far more backs and wideouts on your fantasy team, and if we were to go any further, our correlations for the non-quarterback positions would only get stronger. Because, as we know through playing fantasy football, the late rounds are full of busts. That would strengthen the correlation.
Among these positional groups, average draft position (how we feel about a player entering the season) versus fantasy points scored (how the player performed) actually has the lowest correlation at the quarterback position.
| Positional Grouping | R Squared |
|---|---|
| Top-48 RB | 0.21 |
| Top-48 WR | 0.23 |
| Top-24 QB | 0.13 |
Naturally, as we shrink these groupings, our R Squared value becomes smaller. There's less of a correlation between where you're drafting players and how they finish the fantasy football season because you're comparing good players to good players, not good players to good players and bad players.
| Positional Grouping | R Squared | Positional Grouping | R Squared |
|---|---|---|---|
| Top-24 RB | 0.11 | Top-12 RB | 0.00 |
| Top-24 WR | 0.10 | Top-12 WR | 0.10 |
| Top-12 QB | 0.05 | Top-6 QB | 0.01 |
This does tell us that we're not very good at forecasting in fantasy football, but let's not be too hard on ourselves. Flukey things happen in football all of the time, like a random torn ACL during the first game of the season. That drives down these R Squared values.
There's been no correlation, though, between fantasy points scored and average cost among top-six -- high-end quarterbacks -- since 2011. This may seem unbelievable, but when looking at the data, it's not. The top quarterbacks selected in fantasy drafts over the last seven years have averaged 247.94 fantasy points scored per season. Even in 2017, which was a down year for the position, that would've ranked outside the top-12 at quarterback.
Actually, over the last seven years, the second, third, fourth, and fifth quarterback groupings have all averaged more fantasy points scored than the top quarterback subset. A lot of that has been due to misfortune -- it's had to do with injuries -- but those occur at all positions. You can't remove that from the data unless you do the same at running back and wide receiver, too.
Predictability is also important at the weekly level.
Your fantasy football league's waiver wire is just a surplus of goods. All of the unneeded players are hanging out there. But thanks to the concepts above, there are reliable quarterbacks to choose from each week in a standard league.
This is the first reason you can effectively "stream" the quarterback position in fantasy football. There's excess at the position -- there are starters on the waiver wire in most leagues -- and because of this, you can pick them up by matchup to assemble sort of this Frankenstein quarterback each season. Instead of using one quarterback, you use many. And it's proven to be a successful strategy.
The other reason you can stream is due to predictability.
In 2017, there were 110 different wide receivers who posted at least one weekly top-24 performance. And that excludes the fantasy football worthless Week 17.
That means well over 100 wideouts were usable in most leagues at some point last year. Sort of. But not really.
The reality is that plenty of those performances weren't predictable. Did you think about using Mack Hollins in Week 7 last year when he finished as WR18? Probably not, because up until that point, he'd been averaging just 0.83 targets per game. During that week, he caught a 64-yard bomb for a touchdown, making him a functioning fantasy football asset. But he wasn't actually one because no fantasy owner was out there predicting he'd catch his only target for a 60-plus yard score.
A lot of you know what standard deviation is -- it's a measure used to quantify the amount of variation in a set of data. A dataset with a high standard deviation means the data points within that set are located further away from the set's average. When the standard deviation is lower, each point will tend to be closer to the mean.
Comparing standard deviations from one dataset to the next can be difficult because each set is unique. Some may involve super small numbers, while others may have incredibly large ones.
So, in order to compare one set of data to the next, smart people created the Coefficient of Variation (CV), which takes a dataset's standard deviation and divides it by its average. This allows us to see the extent of variability in relation to the mean.
Basically, the higher the CV, the more variability in your data set. The lower, the more predictable.
I bet you can't wait to tell your friends about this.
We can actually use the Coefficient of Variation to illustrate the spread of weekly scoring at different positions in fantasy football. And it helps show predictability very well.
| Coefficient of Variation | |
|---|---|
| QB1 to QB6 | 38.71% |
| RB1 to RB12 | 47.11% |
| WR1 to WR12 | 52.32% |
| TE1 to TE6 | 48.53% |
The table above is displaying the CV averages for high-end QB1s, all RB1s, all WR1s, and high-end TE1s in fantasy football last year. And the Coefficient of Variation was calculated by looking at the standard deviation and average in week to week scoring among the players who finished in these positional buckets. So the QB1 to QB6 range, for instance, includes Russell Wilson, Cam Newton, Tom Brady, Alex Smith, Carson Wentz, and Kirk Cousins.
As you can see, the quarterback group has the lowest CV and, as a result, had the least amount of variability week to week.
What's interesting, though, is how this looks when you continue to break down the positions by roster group.
| Group | CV | Group | CV | Group | CV |
|---|---|---|---|---|---|
| QB7 to QB12 | 38.18% | QB13 to QB18 | 44.67% | QB19 to QB24 | 57.74% |
| RB13 to RB24 | 61.66% | RB25 to RB36 | 74.42% | RB37 to RB48 | 91.01% |
| WR13 to WR24 | 57.38% | WR25 to WR36 | 68.25% | WR37 to WR48 | 68.90% |
| TE7 to TE12 | 64.58% | TE13 to TE18 | 70.95% | TE19 to TE24 | 82.79% |
Take a peek at the QB7 to QB12 cluster. Not only does it have a near identical CV to the high-end QB1 group, but it's actually lower than the RB1 and WR1 subsets. In other words, low-end QB1s have less variability than top running backs and wide receivers do in weekly fantasy football scoring.
And, if you notice, low Coefficient of Variations exist everywhere at the quarterback position. Low-end QB2s -- quarterbacks ranked 19th to 24th -- had less variability last season than the typical RB2. Think about what that means: Jacoby Brissett was more predictable than Jordan Howard.
What's key here, too, is the change in CV as you move from one positional group to the next. Do you see how RB1s had a 47.11% CV last season, and then that falls over 14% when moving to RB2s? That means that not only were those strong fantasy backs providing high point totals, but they were also more consistent. They were, overall, more predictable.
This is all actually quite intuitive. Going into a given week, you feel more confident about your quarterback projections because you know a starting quarterback is bound to drop back to pass 30 or more times in a game. The sample size is fairly large -- the number of times he'll touch the ball is greater than at any other position.
Quarterback value actually diminishes because the position is more predictable than other ones in fantasy football. There are loads and loads of Mack Hollins-type wide receivers on your waiver wire at a given time, but none of them will have a more predictable weekly forecast than the handful of starting quarterbacks who are also available.
Scoring Variance
The thing is, predictability doesn't equate to value. If all of those waiver wire quarterbacks are scoring eight fantasy points per game, then streaming wouldn't be a very viable strategy.
But they're not.
Along with predictability, we should be looking at the type of scoring edge that can be had at each position in fantasy. If, for example, we typically see just a small number of quarterbacks who are vastly outperforming the rest of the position, then those players are valuable. They're worth a lot because they're a lot better than their peers.
One simple way of showing value is through the lens of "usable" performances. For wide receivers and running backs, a usable performance is one where the player finished in the top-24 at his position in a given week. He, in essence, was worthy of being in a 12-team league starting lineup, as most leagues start at least two running backs and two wide receivers.
For quarterbacks (and tight ends), that usable performance has to be a top-12 one because teams are only starting one of them in a 12-team league.
Over the last five years, here's the average number of usable performances seen by running backs, wide receivers, and quarterbacks per season (Week 17 excluded from the data).
| Usable Performance Instances | RB | WR | QB |
|---|---|---|---|
| 15+ | 0.2 | 0.0 | 0.0 |
| 14+ | 1.6 | 0.0 | 0.0 |
| 13+ | 2.4 | 0.8 | 0.2 |
| 12+ | 3.2 | 0.8 | 0.2 |
| 11+ | 6.2 | 2.0 | 1.0 |
| 10+ | 9.2 | 3.8 | 3.6 |
| 9+ | 12.2 | 7.4 | 4.8 |
| 8+ | 16.6 | 11.4 | 7.0 |
| 7+ | 21.8 | 17.8 | 11.8 |
| 6+ | 26.0 | 25.4 | 15.8 |
| 5+ | 35.0 | 33.6 | 20.2 |
| 4+ | 44.6 | 44.0 | 23.2 |
| 3+ | 51.8 | 58.8 | 29.0 |
| 2+ | 66.8 | 80.6 | 33.6 |
| 1+ | 84.4 | 104.2 | 40.8 |
This chart is telling us is that, since 2013, we've typically seen six running backs with 11 or more usable performances per year. At wide receiver, that number is two. At quarterback, it's one.
What's key within this chart is the overall spread of usable weeks within a position. Only one or two running backs are giving you 13 or more usable performances per season, and the last worthy starter in your league -- the 24th running back -- is giving you between 6 or 7. That means those few running backs are giving you a pretty significant edge week in and week out. If you have those guys, you're crushing it.
We don't have that with top quarterbacks. Generally, one will have 11 or more usable weeks in a season, but 12 of them -- so this would theoretically include all starters in your 12-team league -- have 7 or more. That scoring advantage isn't as significant.
And, keep in mind, your attempt to obtain these top players is really no different from one position to the next. If anything, our average draft position to points scored correlations favor wide receivers most.
Doing the same exercise for top-12 (running backs and wide receivers) and top-6 (quarterbacks) performances -- or "elite" performances -- yields similar results.
| Elite Performance Instances | RB | WR | QB |
|---|---|---|---|
| 14+ | 0.2 | 0.0 | 0.0 |
| 13+ | 0.2 | 0.0 | 0.0 |
| 12+ | 1.0 | 0.0 | 0.0 |
| 11+ | 1.4 | 0.0 | 0.0 |
| 10+ | 2.0 | 0.2 | 0.0 |
| 9+ | 3.4 | 0.6 | 0.4 |
| 8+ | 4.6 | 1.8 | 1.4 |
| 7+ | 6.0 | 4.0 | 2.4 |
| 6+ | 8.8 | 7.4 | 4.4 |
| 5+ | 13.6 | 11.4 | 6.2 |
| 4+ | 19.4 | 18.4 | 11.8 |
| 3+ | 28.2 | 29.2 | 16.2 |
| 2+ | 39.4 | 45.0 | 21.0 |
| 1+ | 61.8 | 74.2 | 32.0 |
You're likely to find more week-to-week difference-makers at running back and wide receiver than you are at quarterback. And there are a couple of reasons for this. First, because of the supply and demand concept above, it becomes harder for quarterbacks to finish as worthwhile in a given week. In order for them to be meaningful -- at least when we look at data in this manner -- they've got to beat out more players at their position.
The other reason, though, is just general scoring variance.
Fantasy football is driven by volume. At the running back position last year, only four players averaged 10-plus carries while seeing 5 or more targets per game. At wide receiver, only four averaged 10 or more targets per game.
All but two NFL teams last season averaged 30 or more pass attempts per contest. And nearly half the league averaged 35 or more.
This is why these charts show what they show. When every single team is going to throw the ball a decent bit during a football game, that increases the probability that a random one-off quarterback is going to succeed. If 32 professional quarterbacks are hitting 30-plus attempts in a given week, it shouldn't be shocking to see parity at the position.
And when you combine that with the fact that these performances are more predictable, you're able to exploit the game. You're able to win by drafting your quarterback late.
The Transition to Superflex
When you add another quarterback into the starting lineup mix, everything changes.
The supply and demand equation is thrown off. Opportunity cost is different. Scoring variance isn't the same.
And this forces us to change the way we draft the quarterback position.
Supply and Demand
If you recall, the 12th quarterback in an ordinary 12-team league has been drafted, on average, at pick 89.6 overall since 2011.
That's definitely not been the case in superflex and two-quarterback leagues.
| Average Pick Since 2013 (1QB) | Average Pick Since 2013 (2QB) | Difference | |
|---|---|---|---|
| QB1 | 16.5 | 4.7 | +11.8 |
| QB6 | 58.6 | 29.0 | +29.6 |
| QB12 | 92.4 | 47.9 | +44.5 |
| RB1 | 3.0 | 3.4 | -0.4 |
| RB12 | 30.4 | 33.3 | -2.9 |
| RB24 | 70.1 | 72.8 | -2.7 |
| WR1 | 4.4 | 6.0 | -1.6 |
| WR12 | 30.8 | 34.3 | -3.5 |
| WR24 | 55.7 | 63.7 | -8.0 |
Thanks to Sal Stefanile of TwoQBs.com, I was able to get my hands on some two-quarterback league average draft position data since 2013. And, thanks to that data, you can easily see the movement in prices when playing in the superflex (or two-quarterback, where things won't be dramatically different) format.
The top quarterback, as an example, has been drafted nearly 12 spots higher in a superflex league since 2013 than a single-quarterback one. The sixth-most popular one has been selected nearly 30 spots higher. And the 12th quarterback -- the last hypothetical starter in a standard league -- gets drafted about 45 picks higher.
Of course, the reason for this is because the demand side of our supply and demand formula also shifts in this format. The 12th quarterback selected is no longer the last starter in a given league. The 24th one is.
| Average Pick Since 2013 (1QB) | Average Pick Since 2013 (2QB) | Difference | |
|---|---|---|---|
| QB1 | 16.5 | 4.7 | +11.8 |
| QB12 | 92.4 | 47.9 | +44.5 |
| QB24 | 170.0 | 107.3 | +62.7 |
| RB1 | 3.0 | 3.4 | -0.4 |
| RB12 | 30.4 | 33.3 | -2.9 |
| RB24 | 70.1 | 72.8 | -2.7 |
| WR1 | 4.4 | 6.0 | -1.6 |
| WR12 | 30.8 | 34.3 | -3.5 |
| WR24 | 55.7 | 63.7 | -8.0 |
An afterthought in single-quarterback leagues, the 24th quarterback starts falling off of draft boards in the ninth round in a superflex format. The price of a quarterback is drastically different and, as a result, so is the opportunity cost.
Opportunity Cost
To reiterate, some would consider me a VORP hater. The concept of value over replacement is helpful when looking at things from a bird's-eye view, though.
No, your brain isn't playing tricks on you -- this is the same draft board you saw earlier. I know this article is the length of a Harry Potter book, but it hasn't been that long since you saw this thing.
The difference is that this board reflects a superflex (or two-quarterback) draft. Quarterback cost has risen, and running back and wide receiver costs, in turn, have slightly dropped.
When the market changes, so does opportunity cost.
Let's make the same assumptions we did before: the difference in projected points between the RB1 to the RB24 is the same as the difference between the WR1 to WR24 and the QB1 to the QB12. It's 100 points, and those 100 points are being evenly distributed.
Before, that 12th quarterback was being selected in Round 8. The 100 points were being spread across more overall picks, making the opportunity cost in drafting a quarterback larger.
Now, that QB12 has an average cost of about Pick 48. The 100-point spread has shrunk, meaning each pick where you don't get a quarterback becomes more costly.
Had the difference between the QB1 to the QB24 been 100 points, this wouldn't be a big deal. Opportunity cost would still favor a late-round quarterback strategy. But now we're looking at 100 points plus the difference between the QB12 and the QB24. What if that's 200 total points? Or 300?
(It's not.)
Predictability
What we really care about most in fantasy football is optimizing the early to middle rounds of drafts. It's not that the later rounds aren't important: it's just that the early portion of your fantasy draft is where opportunity cost is highest. That means nailing both the player you select as well as players you don't select is more important.
We've already seen how there's little to no correlation between average draft position and fantasy points scored at running back, wide receiver, and quarterback, at least in the early rounds of drafts. That's because the majority of fantasy producers -- at least when looking at season-long numbers -- don't come from the late rounds of drafts. It's not that we're horrific forecasters, it's just that when you analyze only the top-half of drafts, you're bound to see weaker correlation.
Now that the demand side of things is equalized -- now that there are two starting running backs, two starting wide receivers, and two starting quarterbacks per roster in a made up 12-team league -- let's look at the same scatterplot we did earlier, but with the top-24 at each position. Before, we were just looking at top-12 quarterbacks.
If you notice, the trendline (which is linear now to keep things simple) for each position looks nearly identical. This tells us that, as we move down the x-axis -- as we move from the RB1 to the RB2 or the QB3 to the QB4 -- we're seeing a similar drop in overall expected points across each position. At quarterback, you're losing 4.20 points per positional slot. At running back, it's 4.14. And at wide receiver, that rate's 3.51.
"Draft your quarterbacks early in superflex leagues!"
Well, don't forget about our good pal, the Coefficient of Variation.
If we're being real here -- and we should be able to keep it real at this point, since we're seemingly 100,000 words into this thing -- the true edge you're getting at quarterback in expected fantasy points is pretty minimal. We're talking 0.06 points across an entire season per positional slot compared to a running back, and 0.69 (nice) at wide receiver. The difference is pretty meaningless.
So where can you find an edge? In weekly predictability.
If you know that you're not gaining any sort of real value over replacement player advantage by selecting one position over another, then your next goal should be to wait on positions that are predictable. Why? Because if the bad players are at least predictable, and if we know those bad players will sometimes have big weeks, then we can predict those big weeks.
You may remember that the QB19 to QB24 group last season had a Coefficient of Variation of 57.74%. Based on historical average draft position data, those quarterbacks will be drafted between picks 79.4 and 107.3, or the beginning of the seventh round to the end of the ninth in a 12-team league.
The only groupings that were clearly more predictable on a week by week basis than these low-end QB2s last season were the RB1 to RB12 and the WR1 to WR12 ones. To put this another way, when you're drafting a random WR2 or RB2 for your fantasy football squad, he's either as predictable or less predictable week-by-week than a random low-end QB2.
And since these lower-tiered quarterbacks are indeed still posting usable and elite weeks, you're able to exploit this notion of predictability and own your leaguemates.
Scoring Variance
In single-quarterback leagues, we saw that the number of usable weeks by the top quarterback to a low-level starter in your league hasn't been that significant historically. Especially compared to running backs.
With an additional quarterback spot in the lineup, finishing as a top-12 passer in a given week no longer means that quarterback is usable. A top-24 performance equates to usability now.
| Usable Performance Instances | RB | WR | QB |
|---|---|---|---|
| 15+ | 0.2 | 0.0 | 2.2 |
| 14+ | 1.6 | 0.0 | 7.0 |
| 13+ | 2.4 | 0.8 | 11.6 |
| 12+ | 3.2 | 0.8 | 15.8 |
| 11+ | 6.2 | 2.0 | 19.8 |
| 10+ | 9.2 | 3.8 | 21.6 |
| 9+ | 12.2 | 7.4 | 23.8 |
| 8+ | 16.6 | 11.4 | 25.6 |
| 7+ | 21.8 | 17.8 | 27.4 |
| 6+ | 26.0 | 25.4 | 30.2 |
| 5+ | 35.0 | 33.6 | 32.4 |
| 4+ | 44.6 | 44.0 | 35.4 |
| 3+ | 51.8 | 58.8 | 37.4 |
| 2+ | 66.8 | 80.6 | 43.2 |
| 1+ | 84.4 | 104.2 | 49.4 |
We'll generally see a lot of quarterbacks post a lot of usable weeks in superflex leagues each year. And the reason for that is competition. When there are only 32 quarterbacks starting in a given week, that narrows the number of players who even have the possibility of finishing as a top-24 quarterback.
But top quarterbacks really aren't giving you a dramatic edge in usable weeks in superflex leagues. It's true that the "spread" has gotten larger -- you're no longer comparing usable performances to 12 quarterbacks, but to 24 -- but roughly 20 quarterbacks have been posting 11 or more usable performances in superflex leagues, on average, since 2011. That's only four off of the best of the best passers.
Our "elite" performances now consist of top-12 quarterback weeks. You've already seen this data, but before, we were comparing top-12 running back and wide receiver weeks to top-6 quarterback ones. Now, we've got top-12 performances across the board.
| Elite Performance Instances | RB | WR | QB |
|---|---|---|---|
| 14+ | 0.2 | 0.0 | 0.0 |
| 13+ | 0.2 | 0.0 | 0.2 |
| 12+ | 1.0 | 0.0 | 0.2 |
| 11+ | 1.4 | 0.0 | 1.0 |
| 10+ | 2.0 | 0.2 | 3.6 |
| 9+ | 3.4 | 0.6 | 4.8 |
| 8+ | 4.6 | 1.8 | 7.0 |
| 7+ | 6.0 | 4.0 | 11.8 |
| 6+ | 8.8 | 7.4 | 15.8 |
| 5+ | 13.6 | 11.4 | 20.2 |
| 4+ | 19.4 | 18.4 | 23.2 |
| 3+ | 28.2 | 29.2 | 29.0 |
| 2+ | 39.4 | 45.0 | 33.6 |
| 1+ | 61.8 | 74.2 | 40.8 |
Just to be clear, the goal here isn't to look at the sheer number of elite performances and deem one position more valuable than another. It's more about how much greatness exists within a position. If only a select few players per season are giving you loads and loads of elite performances, then those players are super valuable to your fantasy football team.
And given this data, top-notch quarterbacks aren't giving you this significant edge over a low-end starter in your superflex league versus what we see at wide receiver and especially running back.
So if there's no unique scoring edge to be had at the quarterback position in superflex leagues when compared to running back and wide receiver, and if we know signal-callers are more predictable week to week, then what does that tell us?
You probably know that answer.
Your Approach to Superflex Leagues
You can make a strong argument that from a value over replacement level standpoint, getting quarterbacks early in a superflex league is the way to go. Locking up Aaron Rodgers before Julio Jones actually makes sense.
But fantasy football is a game where there's interaction. You fix your lineup. You make important weekly decisions throughout a season.
And, for whatever reason, that's the part of the game that's most overlooked.
Here's what we know: the weekly scoring edge that you can achieve at quarterback in a superflex league is not a whole lot different than what we get at running back and receiver. All the while, quarterback is predictable week by week. It's easier to pinpoint a bottom-of-the-barrel quarterback starter who will perform well than it is a lower-end running back or wide receiver.
So use that to your advantage. Be patient. Wait.
I get it, I get it -- you can't wait forever on quarterbacks in a superflex league like you can in a single-quarterback one thanks to supply and demand. The demand increases in the format, but the supply is the same. There are still only 32 starting quarterbacks in the NFL.
That means the quarterback pool eventually becomes extinct during a superflex draft. And if you get caught waiting an unnecessary amount of time to snag your quarterback, then, well, enjoy your Josh McCown.
Waiting takes on a new meaning in these multi-quarterback leagues. You should absolutely be getting a passer in the single-digit rounds. You should get more than one of them. But compared to your leaguemates, you should still be getting your quarterback later than normal.
We have to be cognizant to the fact that it's very rare for a fantasy football squad to have zero holes. Just given the guidelines to the game and how many teams there are in a regular league, it's very difficult to have a flawless squad, especially if you're competing against 13 or 15 other teams.
Sure, I'd love to have Tom Brady, Drew Brees, Todd Gurley, Le'Veon Bell, Odell Beckham, and Keenan Allen on my fantasy football roster. I also know that's not possible in any sort of competitive league.
Pick and choose where you can win. And do it through probability and math.
The strategy in a superflex league, then, would be to draft three -- even four if you're just trying this out for the first time -- middling quarterback starters and play them by matchup each week. Does that mean you get your first quarterback in Round 7? No, not necessarily. You've got to be aware of how your draft is moving. Quarterbacks will run out. The position will lose its pulse. If you see your leaguemates overvaluing the position early, then you have to be reactionary to that in some way.
Your end goal, though, should be at least three average, ordinary quarterbacks who you then can play by matchup each week, all while winning the running back and wide receiver battle.
This is what the numbers are telling you to do, at least. You're not gaining a huge scoring edge by getting a quarterback early (scoring variance), they're more predictable week to week (predictability), and even in a superflex league, these lower-end starters are still being selected later than the bottom running back and wide receiver starters (opportunity cost).
Superflex leagues aren't the norm yet, but we should want them to be. We should embrace change to this game that we all love. Because with change comes new and hidden ways to win your league.
And who wants to win without having to think?


