


Analyzing Trends in FanDuel's 2018 Perfect Daily Fantasy NFL Lineups


This past NFL season was one of change. FanDuel added a flex spot in lieu of a kicker, teams were finding the end zone at a record pace, and running backs were bathing in fantasy points. Now that we're finally into the offseason, it's time to step back and ask one key question.
What in the heck just happened?
While teams were putting scoreboard lightbulbs through the wringer, our prior thought processes with daily fantasy football got shipped to the attic. Games were shooting out left and right, pushing quarterback scoring to new heights, and if you didn't adjust, you were going to get left behind.
This makes it essential that we look back on this past season to try to digest as much as we can. If we can spot trends that popped up, we can try to exploit them heading into next year and have a leg up on those who revert back to old ways.
One way to do this is by looking at perfect lineups.
Each Monday on numberFire, we publish the best lineup you could have built on the previous day's main slate. There were 17 main slates during the regular season, meaning we've got a pretty hefty amount of data to work with once the season is all wrapped up. It will also give us insights into what changed in 2018 and what it means for our lineups going forward.
Today, we're going to look into those findings to see what we can learn. By comparing what we find in this year's lineups to 2017's optimal outputs, we should be able to identify those trends and get some key takeaways.
We'll start things off at the high level by discussing stacking before doing a position-by-position breakdown of what it took to crack a perfect lineup in 2018. What all can we find out by diving into this? Let's check it out.
Game Stacks
If there were more shootouts in 2018, it would stand to reason that there would be more instances where opposing players in the same game both went off. The data backs this up.
Back in 2017, there were 14 instances in which at least one player from each side of a single game wound up in the perfect lineup (otherwise known as a game stack). This year, that number shot up to 19, and it often involved multiple players on either one or both of the sides.
In total, 48 players in perfect lineups this year were part of a game stack. That accounts for 31.4% of all players in a perfect lineup, up from 23.5% in 2017. That's an increase of 33.3% in a single season.
Part of this could just be due to variance, and it's possible that number will regress a bit in 2019. But given the way the game is trending with more high-scoring affairs, we should expect game stacks to play a vital role in optimal lineups for 2019, as well.
If we're going to game-stack aggressively going forward, though, we have to know the best way for doing so, both from a game environment perspective and in choosing which positions stack together best. Let's start with the positional aspect.
If we dissect the multi-player stacks and look at how often one player with one team was stacked with another player on the opposing team, we wind up with a total of 33 different game-stacking combinations. Here's how often each positional pairing popped up in that sample.
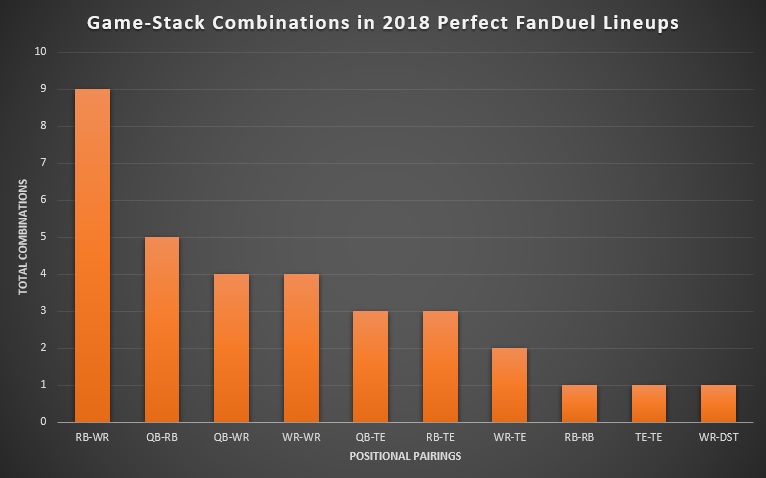
The easy leader was a running back stacked with a wide receiver on the opposing team, something that happened nine times. There were also three instances in which a running back was stacked with the opposing tight end, and the back was tied to the opposing quarterback five times. In essence, associating your running backs with pieces of the opposing team's passing offense was a fruitful strategy this year.
It's not hard to figure out why this was the case if you think about it quickly. Once a team gets a lead, it is able to pump more volume the running back's way to try to burn clock. Meanwhile, the other team has to throw to make up ground, giving the pieces tied to their passing game extra chances to rack up points. This is a spot where the anecdote and the data align.
There's an easy way to bake this into your process for 2019. When you plug a running back into your lineup, you should ask, "Would someone on the opposing team benefit if this player goes off?" By using that running back in a tournament lineup, you're making the assumption that player does well. Are there any additional players you can assume will benefit if that does wind up being the case? If so, you should feel fairly secure in using that player on the same roster.
As far as the number of players to use in a game stack goes, this one is a bit more flexible. Of the 19 total game stacks, 12 of them involved just one player on each side. But there were also four instances in which there were four players from a single game all in one perfect lineup (out of nine total players, counting the defenses and special teams). This likely means that you don't need to go overboard in your game stacking, but if you really love a particular contest, it's okay to make your roster revolve around it.
As for which games you should focus on, the data here isn't going to shock you. You'd assume that higher-scoring games would be more conducive to stacking, and that assumption would be spot on.
Here's a comparison of the totals and spreads in perfect-lineup game stacks with season-long averages in each category. In this instance, the direction of the spread is disregarded because the game stack involves both teams.
| 2018 Averages | Average Total | Average Spread |
|---|---|---|
| Perfect-Lineup Game Stacks | 49.6 | 5.5 |
| All Games | 46.5 | 5.4 |
The spreads were pretty much a wash, and there were four game stacks in perfect lineups with a spread of 10 or more points. But a high total was fairly necessary.
Of our 19 game stacks, 9 had a total of 50 or higher, and 3 more had a total at 49.5. Again, this is intuitive, but it does back up the assertion that oddsmakers know what they're doing when they set a total.
Combining our two larger talking points, 8 of 19 game stacks in perfect lineups had a total of 49.5 or higher and included a running back paired with a pass-catcher on the opposing offense. This seems to be a pretty solid formula for game stacks moving forward. More broadly, though, the big takeaway is that we need to actively be finding games that could be high-scoring and stacking them up in our tournament lineups.
Single-Team Stacks
Single-team stacks were equally as common this year in perfect lineups as they were in 2017, but that's in part because there wasn't extra room for growth. In both seasons, there was at least one pair of teammates in all 17 optimal rosters.
The thing that did change was the positions that were stacked together most often. Here's the same image as above except focusing on the positions involved in single-team stacks this year.
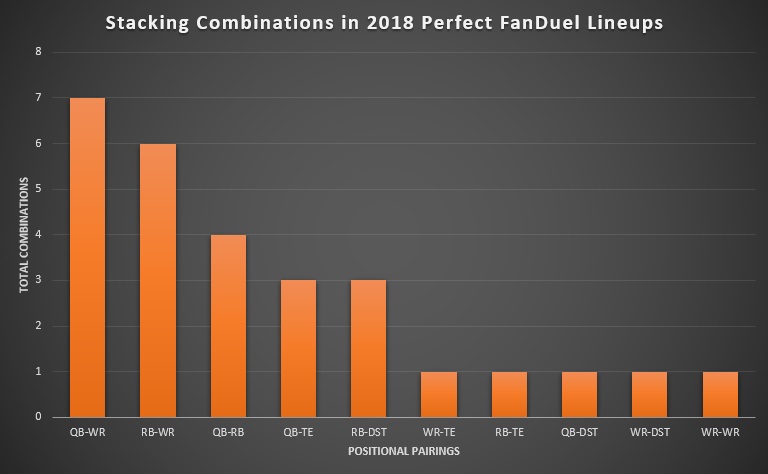
The quarterback-to-wide receiver stack is both the most logical one and has been the most common each of the past two seasons. Stacking a running back with a wide receiver, though, got a shot in the arm during 2018.
Last year, there were just three of these stacks in perfect lineups, a number that got doubled this time around. Why would that be?
Part of it is just that running backs were more popular stacking partners in general than they had been in the past, likely due to the addition of the flex position (more on that momentarily). There were also two additional quarterback-to-running back stacks from last year, and there were two instances in which a stack included a quarterback, running back, and wide receiver from the same team.
As numberFire's JJ Zachariason noted in The Late-Round Podcast, four of the eight largest target market shares for running backs since 2011 occurred in 2018. Running backs are just more involved in the passing offense than they were in the past. As such, if a quarterback has a good game, it makes sense that both his running back and wide receiver would stand to benefit, making them logical inclusions in a stack together.
Even with this rise in backs, though, single-team stacks still revolved around the quarterback. As you can see above, three of the four most common stacking combinations involved a quarterback. A quarterback was stacked with at least one teammate in 12 of 17 perfect lineups, and he was stacked with two teammates three times in that span. This represented each instance in which three teammates appeared in the same perfect lineup.
In other words, if you're going to load up on one offense, you need the quarterback to be involved. The odds that they blow up without taking him along the way are slim, and the upsides of including him are clearly quite large.
Additionally, if you roll a quarterback out without stacking him with one of his teammates, you'll generally be missing out on production at other spots in your lineup. Sure, he could go off with his legs (more on that in the section on quarterbacks), but even then, one of his skill-position assets is still likely to have a solid outing.
As with the game stacks, these single-team stacks generally came within projected higher-scoring games. The average total for players in a single-team stack was 49.1, and the teams were favored by an average of 3.5 points. The blueprint was high-scoring, close games.
| Spreads for Perfect-Lineup Stacks | Occurrences |
|---|---|
| Favored by 10 or More | 4 |
| Favored by 5 to 9.5 | 3 |
| Favored by Less Than 5 | 9 |
| Underdogs by Less Than 5 | 5 |
| Underdogs by 5-Plus Points | 1 |
The spread was less than 5 points for 53.1% of all NFL games this year, but those tighter games accounted for 59.1% of all inclusions in perfect-lineup stacks. And remember, this is just how the game is projected, not how it wound up being. There are pretty obvious benefits to getting players in close games, and those were evident in our data here.
To put a bow on these sections, the general takeaway here is that stacking -- both games and individual teams -- is your friend. It pops up in perfect lineups every week, and the anecdotal advantages of it are there, too. You're going to lose money if you don't stack.
In general, you want to stack games that figure to feature a bunch of points and remain close throughout. This way, the teams keep their best players on the field, pumping that volume skyward for the whole 60 minutes.
The best part about all of this? That aforementioned addition of a flex spot just makes stacking even easier. Because 2018 was the first season in which this was available on FanDuel, let's look at how the flex was utilized in the perfect lineups before we go position-by-position.
Flexing in Perfect Lineups
Throughout the past couple of seasons, there have been abundant complaints about tight ends. Given the volatility and lack of palatable depth at the position, it's hard to blame people who get annoyed about having to roster one of these plodding pains.
That didn't stop them from sneaking into the flex spot a couple of times, though.
Overall, it was still very much the year of the running back. But here's the breakdown of how often each position popped up in the flex position of a perfect lineup.
| Position | Times Flexed in Perfect Lineup |
|---|---|
| Running Back | 10 |
| Wide Receiver | 4 |
| Tight End | 3 |
More often than not, you're going to want a running back in your flex spot. It's the way things looked before the season, and it's how it played out in practice. But there's room for at least a rare exception to that rule.
Once you dig in a bit deeper to the specific instances in which a tight end cracked the perfect lineup, it starts to make more sense. Each time, one of the tight ends included was a player with wide-receiver-esque usage, and the other was a value play.
| Week | First Tight End | Second Tight End |
|---|---|---|
| 2 | Travis Kelce | Jesse James |
| 16 | Zach Ertz | Kyle Rudolph |
| 17 | George Kittle | Blake Jarwin |
All three of Travis Kelce, Zach Ertz, and George Kittle had at least 26% of their team's targets this year, making them unicorns at the position. Other tight ends just happened to go off in the same week that those three did well, letting the cheaper options slide into the flex spot.
This can be a model for us next year, even if it's one we should still use sparingly. If you're starved for value but want to pay up at tight end for someone in that upper tier, you can use your flex spot on a lower-salaried tight end. They're generally cheaper than wide receivers, and they're likely to play more snaps than running backs in that same salary tier. It's not a strategy you should use often, but it's at least on the table at times.
As you can see at the top, though, the flex position is truly all about the running backs. They provide the most predictable volume, and as they showed this year, a lot of them have stupid upside. You want that as often as possible. The data's just here to show that you don't have to be locked into that roster construction 100% of the time.
Quarterbacks
As mentioned a couple of times already, 2018 was very much the year of the running back in DFS. They saw a lot of change at that position. But the scoring boom also needs to alter the way we view quarterbacks going forward.
Because there were so many points being scored in real football, it meant you needed to ensure your fake-football quarterback had higher upside than he needed in previous seasons.
You can get an initial glimpse of this by looking at the average composition of a quarterback in a perfect lineup this year, something we'll run through for each position. The "ownership" row refers to the percentage of rosters the quarterback was on in that week's FanDuel Sunday Million, something numberFire premium subscribers can see each Monday.
| Perfect QBs | Averages |
|---|---|
| Salary | $7,647 |
| FanDuel Points | 33.94 |
| Home | 58.82% |
| Spread | -2.2 |
| Total | 49.1 |
| Wind Speed | 5.7 |
| Ownership | 6.59% |
The big number that should stand out there is the 33.94 FanDuel points on average for quarterbacks in perfect lineups. That's up from 30.90 last year, which is a pretty massive difference.
Five of the 17 perfect quarterbacks got there by topping the 40 FanDuel-point barrier; the maximum in 2017 was 37.64. The number of quarterbacks with at least 400 yards passing rose to five from two, and the average passing yardage of a perfect quarterback went up almost 10 yards. You just needed to do more to make the cut this year.
Looking at the passing production doesn't tell the full tale, though. Here's a breakdown of the average stat line of a perfect quarterback this year compared to what they did last year. The passing yardage went up, but so did the rushing output.
| Average Output | Passing Yards | Passing TDs | Rushing Yards | Rushing TDs |
|---|---|---|---|---|
| 2018 Perfect QBs | 340.9 | 3.1 | 34.2 | 0.8 |
| 2017 Perfect QBs | 331.9 | 3.5 | 22.8 | 0.3 |
Three of 2018's perfect quarterbacks scored twice on the ground, and 11 of them hit paydirt with their legs at least once. Given the value of a rushing touchdown compared to a score through the air, it's easy to see why this would also lead to inflated fantasy totals.
You could potentially dismiss this as a one-year fluke, but that would seem short-sighted. Josh Allen and Mitchell Trubisky both made multiple appearances in perfect lineups, and Lamar Jackson figures to get in a full year as a starter next year. Rushing production from quarterbacks isn't likely to go away.
A quarterback doesn't need to be fleet of foot to get rushing production as Matt Ryan, Drew Brees, and a hobbled Aaron Rodgers all had multi-touchdown days on the ground this year. But if you want a quick way to unlock some extra upside -- and based on scoring this year, we're going to need it -- rushing volume can get you there, and we're going to want to give this some weight in tournaments.
Another interesting development at quarterback this year was the number of quarterbacks who made the perfect lineup when their teams were slight underdogs. Seven of our 17 quarterbacks were on teams that were underdogs by 3.5 or fewer points, an increase from five last year. This makes up a significant part of our sample, and it's pretty easy to understand why.
Because these quarterbacks are underdogs, it's likely going to force them to throw a bit more (and as we saw, passing yardage was higher this year in perfect quarterbacks). But they're also not huge underdogs who are forced to chuck it when the defense knows a pass is coming. Only one quarterback this year and one last year made the perfect lineup while on teams that were underdogs by more than 3.5 points.
This seems to imply that there is upside in quarterbacks who are in this projected game script. There is some risk there if the opposing team gets out to a big early lead, but the possibility of a close game with a lot of passing should get us excited going forward.
As you can see in the chart above, the average salary of a perfect quarterback was $7,647, down from $8,012 last year. Part of that is because of outliers like Ryan Fitzpatrick at $6,200 in Week 1, but in general, it was profitable to save salary.
| Salary | Number of Perfect QBs |
|---|---|
| $9,000 or Higher | 1 |
| $8,500 to $8,900 | 2 |
| $8,000 to $8,400 | 3 |
| $7,500 to $7,900 | 5 |
| $7,000 to $7,400 | 2 |
| Lower Than $7,000 | 4 |
Only six quarterbacks made a perfect lineup with a salary of $8,000 or higher compared to 11 below that number. This is in line with last year when the numbers were the exact same for each split, though the average wasn't brought down by the punt-ish quarterbacks who were present in 2018.
When you look at the names of the lower-salaried quarterbacks who made the cut, you can start to see a blueprint develop. Allen and Trubisky made it with salaries below $7,000, and so did Fitzpatrick. All three of those players can generate fantasy points with their legs. The same is true with Blake Bortles, who made the cut at $7,000.
If you find a quarterback with a lower salary who has a path to upside via his rushing abilities, you should be pretty intrigued by them. Be on the lookout for quarterbacks who fit this mold early in 2019.
Finally, it's worth having a discussion around the popularity of the quarterbacks who made perfect lineups. As you saw above, the average quarterback was on 6.59% of all rosters in the FanDuel Sunday Million, which is to be expected given that you can roster only one, putting a lid on ownership at the position. But a deeper look shows just how favorable it was to dig for some under-the-radar gems.
| Ownership | Number of Perfect QBs |
|---|---|
| Higher Than 15% | 2 |
| 10% to 14.9% | 2 |
| 5% to 9.9% | 4 |
| Lower than 5% | 9 |
In general, it's okay to swallow some chalk at quarterback because they don't wind up being overly popular (only three quarterbacks were on more than 20% of all Sunday Million rosters in a given week this year). You can, though, find contrarian options with slate-busting upside.
Trubisky, Fitzpatrick, and Allen all made the perfect lineup while on less than 1.5% of all rosters. They also happen to fit the mold discussed before with lower-salaried quarterbacks with rushing upside. You don't have to exclusively target these types of players, but they should at least grab your attention.
Based on this, we should have a quasi-template for quarterbacks on tournament rosters. We need to ensure that they have a path to get to 30 FanDuel points, whether it be via their arm or their legs, they should ideally come with a lower salary, and we'll want to search for quarterbacks we believe will go overlooked. Although this isn't a template we must always follow, it will give us tremendous upside while lending us additionally flexibility to spend up elsewhere.
Running Backs
At quarterback, it was beneficial to hunt for more contrarian options who would be rarities on other rosters.
At running back, that strategy would leave you gasping for air.
| Perfect RBs | Averages |
|---|---|
| Salary | $7,545 |
| FanDuel Points | 29.8 |
| Home | 40.91% |
| Spread | -2.4 |
| Total | 47.9 |
| Wind Speed | 5.0 |
| Ownership | 20.95% |
The average perfect running back was on a higher percentage of rosters than the most popular quarterback in a perfect lineup all year. This is what you expect given that you can roster up to three running backs, but the difference is ghastly.
Because of the 10 running backs in a flex spot, there were 44 running backs in perfect lineups this year. Of those 44, 13 of them were on at least 30% of all rosters compared to just 12 who were on less than 10%.
| Ownership | Number of Perfect RBs |
|---|---|
| 30% or Higher | 13 |
| 25% to 29.9% | 6 |
| 20% to 24.9% | 4 |
| 15% to 19.9% | 5 |
| 10% to 14.9% | 4 |
| 5% to 9.9% | 5 |
| Lower Than 5% | 7 |
Basically, we were really good at picking running backs this year. Other positions? Not so much, as you'll see in just a bit.
Running backs have the easiest volume to predict, making them generally stable assets for daily fantasy football. As such, we should be willing to use a running back even if he will be abundantly popular.
The other potentially annoying attribute that we have to simply accept at running back is high salaries. As you can see, the average salary of a running back in a perfect lineup this year was $7,545, an increase from $7,132 last year. Todd Gurley alone cracked the perfect lineup five times with a salary of $8,900 or higher, and he was not alone.
| Salary | Number of Perfect RBs |
|---|---|
| $9,000 or Higher | 6 |
| $8,500 to $8,900 | 7 |
| $8,000 to $8,400 | 7 |
| $7,500 to $7,900 | 4 |
| $7,000 to $7,400 | 3 |
| $6,500 to $6,900 | 5 |
| $6,000 to $6,400 | 5 |
| Lower Than $6,000 | 6 |
Overall, 45.5% of all perfect running backs carried salaries of $8,000 or higher, an increase from 38.2% last year. It paid to pay up.
In one sense, this could seem a bit strange. The nature of "perfect" lineups is that we're catching running backs at the high end of their expected outcomes each time. These were the successful backs only, meaning that when a mid-salaried running back busted, it didn't show up in this data at all. When he had one of his good days, he should have made the cut pretty easily. So, why, then, did the data skew so heavily toward the higher-end players?
It all revolves around their passing-game work. If a running back gets more work in the passing game, it's going to amp up his average output, and his salary will increase as a result. So, if you want a running back who gets work in the passing game, you're going to have to pay the piper. And involvement in the passing game was almost a must for landing in the perfect lineup.
| Average Output | Rush Yards | Rush TDs | Receptions | Receiving Yards | Receiving TDs |
|---|---|---|---|---|---|
| RBs in Perfect Lineups | 111.3 | 1.5 | 4.3 | 45.4 | 0.5 |
The only running back in a perfect lineup this year who didn't have a single catch was Adrian Peterson in Week 3. In that game, he had 120 rushing yards and 2 touchdowns.
Only six other running backs made a perfect lineup with just one reception. One of those players was Kareem Hunt, who turned his lone reception into a 50-yard touchdown. Isaiah Crowell was the only player who had less than two receptions who didn't score two rushing touchdowns, and he has 219 yards rushing that day.
In other words, if you didn't get receptions, you needed to blow the eff up as a rusher in order to crack a perfect lineup. This is why guys like Peterson, Chris Carson, Phillip Lindsay, Jordan Howard, and Sony Michel -- all players with limited roles in the passing game -- combined to make the perfect lineup just one more time than Tarik Cohen.
Earlier, we talked about how it's unwise to fade backs just because they are projected to be popular. The exception here is when that back isn't a huge threat as a receiver. Not only does that put a dent in their floor, but as you can see here, the odds that they blow up and burn you for fading them are low. If you have concerns around a back in this mold, and they look like they'll be on a bunch of rosters, it's not a bad idea to look elsewhere.
Another number that should stick out on the original chart is that the average perfect running back was on a team that was favored by just 2.4 points. When we think of running backs, we tend to assume we want them on teams that are heavily favored because it leads to additional rushing volume. The data here seemed to contradict that a bit.
| Spread | Number of Perfect RBs |
|---|---|
| Favored by 10 or More | 5 |
| Favored by 5 to 9.5 | 8 |
| Favored by Less Than 5 | 19 |
| Underdogs by Less Than 5 | 8 |
| Underdogs by 5 or More | 4 |
As you'll remember from our discussion on stacking, 53.1% of games this year had a spread of less than five points, but 61.4% of our running backs came from that sample. By contrast, 15.2% of games included a spread of 10 or more points, but only 11.4% of our running backs were on teams favored by at least that margin.
This would seem to push forward a couple of narratives. First, we want even our running backs to be in competitive, high-scoring games. This ensures they'll be on the field deeper into the contest and not resting up for the next week.
Second, it goes hand-in-hand with our discussion around work in the passing game. If a team is blowing out an opponent, the odds they have to use their running back as a receiver go down, which is a detriment to their ceiling.
We don't have to go out of our way to avoid running backs who are heavily favored, especially if that running back is the focal point of the offense in the red zone. However, we also shouldn't actively target those backs just because the spread is heavily in their favor, and we should potentially give a slight bump to backs in competitive games who will have a shot to get targets into the fourth quarter.
Although the grand majority of our running backs were costly, there were some value plays, too, with six players checking in with a salary below $6,000. Most of those were players jumping into larger roles than what they had previously.
| Perfect RBs Under $6,000 | Week | Situation |
|---|---|---|
| James Conner | 1 | No Le'Veon Bell |
| Tarik Cohen | 4 | Gameplan-Specific Usage |
| Isaiah Crowell | 5 | No Change |
| Marlon Mack | 7 | Increased Snap Rate After Injury |
| Elijah McGuire | 16 | No Isaiah Crowell/Bilal Powell |
| Jamaal Williams | 16 | No Aaron Jones/Ty Montgomery |
Crowell was the only person whose role wasn't different than what it had been previously, though Cohen's role change may not have been predictable prior to kickoff. We should be inclined to take advantage of salary inefficiencies when we find them.
Even in these scenarios, the running backs' expanded roles generally included work in the passing game. Crowell was the only one in that group not to score a receiving touchdown or get at least 50 yards receiving. If we can reasonably assume a player's target share will increase due to the absence of another player or some other factor, then it's in our best interest to go at them aggressively.
The most important takeaway from our data is that we need to prioritize pass-catching backs, even on a half-PPR site like FanDuel. This is true even if it forces us to splurge a large chunk of our salary on those players or if they'll be chalky options. The floor and ceiling combination of these backs is unreal, and we should take advantage of that predictability wherever we can find it.
Wide Receivers
If we're tossing big bucks at the running backs, you know we've got to spend down somewhere. Those savings tended to come at wide receiver this year.
| Perfect WRs | Averages |
|---|---|
| Salary | $6,315 |
| FanDuel Points | 26.2 |
| Home | 56.36% |
| Spread | -0.5 |
| Total | 47.9 |
| Wind Speed | 5.6 |
| Ownership | 6.94% |
That $6,315 average salary is down from $6,824 last year. It's actually a bigger dip than the increase we saw at running back.
The highest-salaried wide receiver to make a perfect lineup was Antonio Brown in Week 16 at $8,700. There were 10 perfect running backs who had salaries higher than that this year. Part of this was because there were simply more running backs with salaries in this tier, but if you're forced to choose between a high-salaried back and an expensive wide receiver, you should be taking the more predictable route with the running back.
It wasn't just a lack of high-end receivers that dragged the average salary down. There were also just a ton of value options who wiggled their way in this year.
| Salary | Number of Perfect WRs |
|---|---|
| $9,000 or Higher | 0 |
| $8,500 to $8,900 | 5 |
| $8,000 to $8,400 | 2 |
| $7,500 to $7,900 | 4 |
| $7,000 to $7,400 | 6 |
| $6,500 to $6,900 | 7 |
| $6,000 to $6,400 | 6 |
| Lower Than $6,000 | 25 |
This means that 45.5% of the perfect wide receivers had a salary lower than $6,000, the exact same percentage of running backs with salaries at $8,000 or higher. The perfect lineups were your weekly, heavy-handed reminder that you need to spend up at running back.
In an ideal world, we'd be able to take this edict and apply it right away, plugging in those salary-savers in all three slots. It's just hard to know how to identify which wide receivers we should be targeting. After all, those players' salaries are low for a reason.
As such, let's narrow our pool down to just the wide receivers who had salaries below $6,000. Here's the average profile of the perfect wide receivers who fit that bill.
| Salary Below $6,000 | Averages |
|---|---|
| FanDuel Points | 24.4 |
| Receptions | 5.6 |
| Receiving Yards | 110.7 |
| Receiving TDs | 1.6 |
| Home | 68.00% |
| Spread | 1.5 |
| Total | 46.8 |
| Ownership | 3.53% |
Clearly, we weren't very good at identifying these players this year with the average ownership sitting down at 3.53%. Some of the other data, though, could help us improve upon that in 2019.
Even for the lower-salaried wide receivers, you did still need big production. The full sample of perfect wide receivers averaged 7.1 receptions for 123.1 yards and 1.6 touchdowns, and the cheaper receivers were within shouting distance of those marks
The one big difference between the stat lines of these receivers is that the lower-salaried players did a lot with a little. They averaged 19.77 yards per reception, up from 17.34 yards per reception for all perfect wide receivers.
This seems to imply that the value wide receivers who blew up were those who were able to generate big plays. This makes sense because those players will generally be more volatile than their expensive counterparts, keeping their salaries in check.
A look at the names on the list helps back up this line of thought. Robby Anderson and Robert Foster made the perfect lineup twice with salaries below $6,000, and guys like Taylor Gabriel, Kenny Stills, Tyrell Williams, and DeSean Jackson all made cameos. Their floors are low, but they've got the ability to pay off on just one play.
The other thing that stands out here is the average spread. Value wide receivers -- on average -- were underdogs by 1.5 points while the full sample at wide receiver was favored by an average of 0.5 points. This would seem to indicate the value receivers tend to be slight underdogs.
Ten of the 25 value wide receivers were underdogs by less than five points, and an additional five were underdogs by more than that. In total, that leaves us with 15 underdog value wide receivers compared to 10 on teams that were favored.
This calls back to what we discussed at quarterback. These teams were in positions where they'd have to throw a bit extra, but in general, they weren't expected to fall completely on their face and get blown out.
Finally, look at the percentage of these value wide receivers who were at home. That's 68.00% of them, up from 56.36% for the full sample, which is a huge deviation.
Combining all of this together, we've got a pretty solid template for finding value receivers who could move the needle in our favor. We want them to be big-play receivers who get deep targets, they should be playing in close games, potentially as slight underdogs to amp up the volume, and they get a bit spicier when at home compared to being on the road. We'll definitely swing and miss at times when applying this in 2019 -- again, these receivers are likely to come with tons of variance -- but it was a successful formula for finding true difference-makers this past season.
For the higher-salaried wide receivers, it was less about the big plays and more about just getting the ball in their hands as often as possible.
| Average Output | Receptions | Rec. Yards | Yards Per Rec. | Receiving TDs |
|---|---|---|---|---|
| Salary of $7,000 or Higher | 9.1 | 139.5 | 15.3 | 1.4 |
| Salary Between $6,000 and $6,900 | 7.3 | 125.5 | 17.2 | 1.7 |
| Salary Below $6,000 | 5.6 | 110.7 | 19.8 | 1.6 |
Tyreek Hill was the only receiver to make a perfect lineup with a salary greater than $7,000 who had fewer than six catches; in that game, Hill added a rushing touchdown. Volume is king for the expensive wideouts.
This is exactly what you would expect, but it still gives us a solid little flow chart when selecting wide receivers for tournaments. If they're a high-salaried player, we need to make sure we can reasonably expect them to get seven or more receptions. If they're on the lower end of the salary spectrum, we should be willing to accept volatility as long as it's possible for them to hit the high end of that volatility in that specific game.
The final thing to note from that table above is that yardage is required no matter what your salary may be. In last year's perfect lineup analysis, we created a set of requirements before we could stomach using a wide receiver in a tournament: he needed to be able to either score two touchdowns or get at least 85 receiving yards.
That set of requirements held up well in 2018. Of the 55 perfect wide receivers, only one failed to either score twice or get 85 receiving yards. That player was Danny Amendola in Week 7. He had 84 receiving yards and 1 touchdown.
No matter what a wide receiver's salary may be, we're going to need yardage upside out of them. For the higher-end players, that means we need them to rack up the receptions and bathe in targets. For the lower-salaried players, we should be looking to exploit the volatility of the bigger-play guys and use them in the right spots. Identifying players in that mold will be a key for building rosters with high ceilings as we look to jam in high-salaried running backs.
Tight Ends
The overlap between wide receivers and tight ends is both substantial and expected. The two positions have plenty of similarities, so it shouldn't be a surprise that some common threads will crop up.
The big one is going to revolve around salary. As mentioned in the section on flex spots, there were some high-salaried tight ends this year who came through. But if you weren't paying for them, you likely needed to be saving salary at the position.
| Perfect TEs | Averages |
|---|---|
| Salary | $5,775 |
| FanDuel Points | 23.3 |
| Home | 70.00% |
| Spread | -2.1 |
| Total | 48.1 |
| Wind Speed | 5.2 |
| Ownership | 6.64% |
And here's how things shake out once we zoom in on the salaries.
| Salary | Number of Perfect TEs |
|---|---|
| $7,000 or Higher | 4 |
| $6,000 to $6,900 | 4 |
| $5,000 to $5,900 | 5 |
| Lower Than $5,000 | 7 |
Here, the $6,000 range doesn't look bad with four entrants, up from just one last year. But the names in that range are Kelce, Kittle twice, and Trey Burton. Burton is the lone player from that group who had a target market share lower than 26% during the regular season. As such, it seems like the inclusions of those players in perfect lineups were moreso due to a pricing error than something we should look to exploit going forward.
In general, if you weren't getting that high-usage stud, you needed to be saving salary. Twelve of 20 perfect tight ends had salaries of $5,600 or lower, which is very much a value option at the position.
As discussed at wide receiver, this is all well and good to know that we should be spending down at tight end. We just have to figure out what traits can allow a tight end in that range to pop. Let's dig into that now.
The table below shows the average makeup of the 12 tight ends who checked in as value plays. Once again, you're going to notice some overlap with the value plays at wide receiver.
| Salary Below $6,000 | Averages |
|---|---|
| FanDuel Points | 21.4 |
| Receptions | 6.3 |
| Receiving Yards | 86.8 |
| Receiving TDs | 1.5 |
| Home | 75.00% |
| Spread | -3.0 |
| Total | 47.4 |
| Ownership | 3.70% |
As with the wide receivers, being at home was a huge plus for the tight ends. They tended to be favored -- a deviation from the wide receivers -- but it also allows us to tell a tale of why these players came through.
If you want a value tight end to pay off in a hurry, the easiest route is via the end zone. Teams that are favored and at home are more likely to score touchdowns than teams in worse situations. It seems simple, but it truly doesn't have to be super complicated.
Another way of putting this is that we want our value tight ends to be in high-scoring environments. Guys like Kittle and Kelce can excel in almost any situation, but a less-involved tight end is going to need to be on a team that scores points to come through for you.
Of our 12 value tight ends, eight were home favorites. Two of the other four were road favorites, and another was involved in a projected low-scoring game that wound up featuring 71 total points. If you identify a tight end who has a role in his offense and is in a spot where that offense will score some points, it's very much worthwhile to give him a spin.
It's worth noting that this was true for the higher-salaried tight ends, too. The average total for a game that produced a perfect tight end with a salary of $6,000 or higher was 49.1, so touchdowns and a scoring-heavy environment were positives across the board. This type of scenario just provides us with a bit of a cheat code when hunting for value.
The big difference between the higher-salaried tight ends and their value counterparts was yardage. The entire sample of perfect tight ends averaged 107.3 receiving yards, but the bar was much higher for our expensive honorees.
| Among Perfect TEs | Receptions | Receiving Yards | Receiving TDs |
|---|---|---|---|
| Salary $6,000 or Higher | 9.1 | 138.1 | 1.4 |
| Salary Below $6,000 | 6.3 | 86.8 | 1.5 |
As discussed with the wide receivers, this is to be expected because you simply need more raw production if a player is going to take up a larger chunk of your salary cap. It's just that the split here is gigantic.
Of the higher-salaried tight ends to make a perfect lineup, the lowest yardage output was Kelce with 109 yards. This is noteworthy because there were only 28 games this year in which a tight end got 100 yards receiving. If you're going to pay anything more than in the mid-$5,000s at this position, you had better make sure that player has some juice in the yardage department.
The final noteworthy element for tight ends is that -- as with wide receivers -- it was beneficial to deviate from the crowd. Only 4 of 20 perfect tight ends were on at least 10% of rosters in the FanDuel Sunday Million. Both of Ertz's appearances even came when he was on less than 8.5% of all rosters. Tight ends are hard to predict, and we'd be wise to embrace that variance and try to find less popular options.
This all leaves us with a pretty clear plan of attack at tight end. If we're deciding to pay up at the position, we need to ensure they have the ability to churn out a ton of yardage. If we don't find someone who can do that, we should be diving all the way down to the value range, bypassing the mid-tier options if they don't have big yardage in their range of outcomes.
Once we get to the value tier, then we look for players in good offensive environments. We want players on teams that are in line to score points, and you don't always have to splurge to find them. That leads to the "stars or scrubs" approach being a profitable one at this ever-frustrating roster slot.
Defenses and Special Teams
The perception of defenses and special teams is that they're hard to predict -- similar to tight ends -- meaning we should generally want to pay down at this position.
From an ownership perspective, this was true as perfect defenses tended to be on fewer rosters. But the salary thought process there seems to be a bit off.
| Perfect DSTs | Averages |
|---|---|
| Salary | $4,218 |
| FanDuel Points | 19.5 |
| Home | 47.06% |
| Spread | -4.0 |
| Total | 45.1 |
| Wind Speed | 5.4 |
| Ownership | 6.62% |
The average salary of all defenses on the main slate this year was $3,839, but it jumps up to $4,218 when you look at those in perfect lineups. That's a pretty solid jump.
Part of this is due to the nature of perfect lineups. When you can predict with 100% accuracy which value wide receivers and tight ends will blow up, you're going to have more salary to spend on defenses. But the breakdown of the salaries further pushes the narrative that spendy defenses aren't all that bad.
| Salary | Number of Perfect DSTs |
|---|---|
| $5,000 or Higher | 3 |
| $4,500 to $4,900 | 3 |
| $4,000 to $4,400 | 5 |
| $3,500 to $3,900 | 4 |
| $3,000 to $3,400 | 2 |
One of the defenses in the $3,500 to $3,900 range was at exactly $3,900, which means that only five perfect defenses came in with a salary lower than the average. There are certainly advantages to paying down at defense -- especially in cash games -- but there's nothing wrong with splurging a bit for your tournament rosters.
A big part of this skewing toward higher-salaried defenses likely stems from what defenses needed to do in order make an appearance in the perfect lineup. Touchdowns didn't hurt, but more than anything, you had to get after the quarterback.
| Average Output | Points Allowed | Sacks | Fumbles Recovered | INTs | TDs |
|---|---|---|---|---|---|
| DSTs in Perfect Lineups | 11.6 | 4.5 | 1.0 | 2.0 | 0.8 |
A value defense is likely a value for a reason, and it could very well be because they struggle to generate sacks. If you didn't get those from your defense, you likely weren't going to put up a big number at that position.
This abundance of sacks ties into something that's brought up often with defenses: you want to find a defense that's going to get a lead. When that happens, it forces the opposing team to throw, giving that defense extra chances at sacks and interceptions while potentially turning those opportunities into points. Here, our process was correct.
As you can see in the initial table, the average perfect defense entered the game as a four-point favorite, the highest average in favor of any position in our perfect lineups by more than 1.5 points. That's even with the Buffalo Bills making it as a 16.5-point underdog against the Minnesota Vikings in Week 3.
| Spread | Number of Perfect DSTs |
|---|---|
| Favored by 10 or More | 4 |
| Favored by 5 to 9.5 | 5 |
| Favored by Less Than 5 | 4 |
| Underdogs by Less Than 5 | 3 |
| Underdogs by 5 or More | 1 |
There were almost as many perfect defenses that entered as 10-point favorites as there were running backs (five) even though you roster just one defense each week. This is a position where bookmaker info holds plenty of value.
That could lead you to believe that we'd also want to prioritize defenses in games with low totals. After all, the perfect defenses averaged allowing just 11.6 points, and you're not going to get that from a potential shootout very often.
This is one spot where the data does deviate from the anecdote.
Yes, the average total for defenses in perfect lineups at 45.1 was lower than the league-wide average of 46.5. So, to an extent, totals did matter. But some projected shootouts still resulted in big days for the defense.
| Total | Number of Perfect DSTs |
|---|---|
| 50 or Higher | 4 |
| 45 to 49.5 | 3 |
| 40 to 44.5 | 8 |
| Lower Than 40 | 2 |
If you look at popular defenses FanDuel Sunday Million (among the three defenses with the highest ownership each week), only twice did one of those defenses come in a game with a total of 50 or higher. There were more perfect defenses from those projected higher-scoring games even though the sample here (17 defenses) is much smaller than the look at the chalky defenses (51 defenses). The average total of these chalky defenses was 43.2, almost 2 points lower than the average for perfect defenses.
Based on this, it seems likely that we're putting far too much weight on totals when making our decisions at defense. Instead, we should be focusing almost all of our attention on finding defenses that can get to the quarterback and enter the game as favorites. The total can either be used as a tiebreaker or disregarded entirely, and there will be game-theory advantages to rostering intriguing defenses in games with high totals.
Of the four defenses that made a perfect lineup in a game with a total of 50 or higher, the highest ownership on those defenses was 7.10%. The other three were all below 5%, and two others were below 3%. If you had these defenses when they blew up, you had a major advantage over the public, again giving us incentive to be interested in defenses in games with high totals.
We want to be wary of putting too much stock into this because, again, the average perfect defense allowed less than 12 points per game. But it's clear that a high total should never force us to cross a defense off our list.
In general, we seem to be correct in our thinking around defenses when it comes to spread as there is an advantage to using teams that are favored. We should keep our thinking the same there.
The spots where we need adjustments are in salaries and totals. As you can see, it's all right in tournaments to splurge for a defense with upside as long as they can get you points via sacks and have the possibility to cash in on a touchdown. If we combine our thoughts around totals and salaries with our engrained process around spreads, we should be able to gain a leg up over the crowd at this position as we head into 2019.


