


Can a Running Back's Physical Profile Help Predict NFL Success?


It’s very difficult for fans and analysts alike to look at great teams, great players, or great seasons without comparing them. We find it very hard to group these into tiers of excellence, instead preferring to determine and declare one as “the bestâ€.
The most recent case of this was the lead-up to the awarding of college football’s Heisman Trophy for the 2015 season, where two of the top candidates for the award were Alabama Crimson Tide running back Derrick Henry -- criticized for being possibly too big to succeed in the NFL -- and Stanford Cardinal running back Christian McCaffrey -- who many are already hailing as a surefire NFL first-round draft pick when he comes out.
Henry, the eventual award winner, stands 6'3", with a 242-pound frame; McCaffrey is 6'1" and 201 pounds. I understand that is a 40-pound difference in their builds, but I can’t imagine that two inches of height difference will determine Henry’s failure and McCaffrey’s success.
This got me wondering: can we predict professional success for a running back, based on their physical attributes? If so, which ones are most indicative?
Too Big to Fail
So, our mission today is to compare player measurables (height, weight, NFL Combine data) and their professional success and see if we can nail down an idea of what a good NFL running back literally looks like. The way we here analyze success is via our signature metric, Net Expected Points (NEP), which helps us to quantify the amount of value a player creates for his team on the field.
NEP is an analytic helps us take the numbers we get from the box score and shows how that player did versus expectation. By adding down-and-distance value to standard box score information, we can see just how much each play and each team as a whole influence the outcome of games. A rushing gain for five yards on 3rd-and-2 means more to the game than it does on 3rd-and-10, and those plays should be valued accordingly. For more info on NEP, check out our glossary.
I first want to look at our variables -- the measurables in each player’s profile -- to see if any of them line up better than others with career NEP value. I took every running back drafted since 2000 and found the correlation between their physical dimensions and Combine measurables to their career Total NEP, career length, Replacement-Level percentage of career (top-100 running back in a season by NEP), and Elite-Level percentage of career (top-five running back in a season by NEP).
How do they compare?
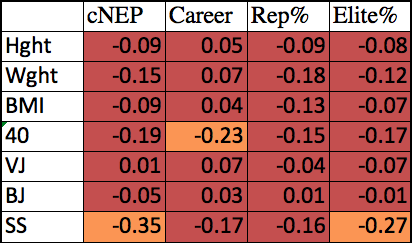
For reference, any ironclad, causal relationship would have a 1.00 or -1.00 value, meaning a perfect 1-to-1 ratio. So, the closer to 0.00 the value gets, the lower the relationship. Anything under 0.20 or -0.20 is considered “negligible,†and that’s where we find the vast majority of our values on this table. Some breach the 0.20 mark into “weak,†but we’re looking for patterns across the board.
The only measurable that seems to correlate solidly to most measures of success for running backs is short shuttle time. The negative correlation means that the lower (faster) a running back’s short shuttle is, the better they will perform in NEP and Elite-Level percentage.
Height correlates almost completely negligibly to success in any measure, and weight has very weak correlations, but -- interestingly -- negative ones (i.e. the less a player weighs, the better they do).
What do these relationships mean, then, for running back success?
Bigger Is Sometimes Better
With our understanding of how much more valuable a few measurables are than others, looking at the outliers within each measurable will help us to understand the workings of each one within itself. We always hope that our favorite players have well-rounded skillsets, but looking at the extremes in the dataset as a whole can help us understand the skills themselves.
I pulled the top- and bottom-10 percent of players within each measurable and averaged those players’ NEP performances, in order to compare the far extremes of each skill. The tables below represent this for all measurables, except BMI, vertical jump, and broad jump -- which had negligible differences in results. What do we find?
| Category | Avg. Value | cNEP | Career Length |
|---|---|---|---|
| Height – High | 73†| 13.39 | 3.96 |
| Height – Low | 68†| 32.44 | 3.42 |
This is compelling because of the vast difference in career NEP favoring shorter running backs, but the career length favoring taller backs. This seems to indicate that height is not an indictment on health and longevity in the league. The disparity in career NEP is likely due to the usage of smaller backs (i.e.
Dion Lewis, Darren Sproles, etc.) as receivers, while bigger backs (i.e. Adrian Peterson, Rashad Jennings, etc.) are used more as rushers. Reception NEP is inherently more valuable than Rushing NEP, so heavy usage on the ground will sink some of these players’ average value.
| Category | Avg. Value | cNEP | Career Length |
|---|---|---|---|
| Weight – High | 244 | 8.23 | 4.35 |
| Weight – Low | 192 | 22.38 | 3.39 |
The difference in career NEP value is undoubtedly due to rushing versus receiving here. With the top 10 percent of drafted running backs averaging a weight of 244 pounds, they are far more likely to be used as rushers -- especially in short-yardage situations -- than their lighter peers. In addition, the heavier backs have a significantly longer average career length (almost a year more) than the low end of the weight spectrum.
| Category | Avg. Value | cNEP | Career Length |
|---|---|---|---|
| 40 – High | 4.37 | 37.80 | 4.62 |
| 40 – Low | 4.71 | 1.61 | 2.35 |
This one seems just flat-out obvious. There has been a pushback against using the 40-yard dash as the sole measurement to put our running backs up by, and we saw that its correlations to success are shakier than other measurables. Still, if the player isn’t fast enough to keep up in the league, they just likely don’t have what it takes to be solid NFL contributors.
| Category | Avg. Value | cNEP | Career Length |
|---|---|---|---|
| Shuttle – High | 3.89 | 30.91 | 3.73 |
| Shuttle – Low | 4.56 | 16.91 | 3.74 |
Based on our correlations, this was a surprising result. I expected the data to line up for the 20-yard short shuttle like it did for the 40-yard dash. It still is a wide difference in value, and being that the career length of both groups is identical, we can see that elite lateral agility in the NFL is worth a significant amount. When we look at both groups, though, a pattern emerges: for the significantly smaller players (i.e.
Brian Westbrook, Dexter McCluster), the short shuttle matters much more. For bigger players, like Joseph Addai and Marshawn Lynch, it’s simply about being quick enough.
Just Right
So, is there any one way to nail down what will make a running back successful in the NFL? Not really. For every Correll Buckhalter that succeeds due to his short shuttle time, there’s a Delone Carter who flounders despite it. A lot depends on which team the player is going to, and how they will use him. The aforementioned Addai was never a physical specimen, but the offense around him was so good it boosted his value.
That’s why the physical average of all drafted running backs (71â€, 216 pounds; 4.53 40-yard dash, 35†vertical, 119†broad, 4.23 short shuttle) is nearly identical to the average of the top 10 by NEP (71â€, 212 pounds; 4.49 40-yard dash, 35†vertical, 119†broad, 4.02 short shuttle).
That’s the beauty of the running back position: with the right set of circumstances, almost anyone with a baseline level of talent can succeed there. As for excelling? We’ll just have to wait until they get to the NFL to figure that out.


