


Fantasy Football: The NFL's Shift Toward Running Back Committees Is Not Turning the Waiver Wire Into a Gold Mine


It's been a while -- four years, that is -- since I took a deep dive into whether or not waiver-wire running backs can replace early-round picks in fantasy football leagues.
I looked at a lot of things there, but ultimately, the years of research concluded with the reality that the efficacy of waiver-wire running backs all depends on your expectations.
Elite, irreplaceable production at the running back position virtually always comes from early-round picks who have claims to (and talent enough to do something with) featured workloads.
(And even accounting for games missed, early-round running backs are worthwhile.)
However, if you are hoping to replace RB3-level fantasy football production by playing the waiver wire, you can do it. Historically, speaking, that is.
That would put you on a path of drafting running backs extremely early (or not at all) and omitting the sketchy picks in the middle and late rounds.
But now, teams aren't relying on singular running backs quite like they used to. (Right?)
How has this impacted the success rate of waiver-wire running backs?
Foregrounding Some Things
It's always good to test assumptions before fighting a straw man. Are featured running backs actually seeing fewer chances per game in the current committee-heavy climate? And is that leading to a fundamental change in how running backs are utilized in recent years?
Let's dig in.
Over the past five seasons, an average of 13.8 backs per season had at least 250 opportunities (carries plus targets) compared to 17.4 the five seasons prior.
Here is an even clearer picture. Here are the opportunities per game generated by top-12, top-24, and top-36 backs (or RB1s, RB2s, and RB3s) year to year since 2012.
| RB Opportunities Per Game |
RB1 | RB2 | RB3 |
|---|---|---|---|
| 2012 | 21.4 | 16.9 | 13.9 |
| 2013 | 21.4 | 16.4 | 14.1 |
| 2014 | 20.6 | 17.0 | 12.5 |
| 2015 | 18.9 | 15.2 | 12.9 |
| 2016 | 21.3 | 17.2 | 11.6 |
| 2017 | 21.1 | 15.5 | 13.3 |
| 2018 | 20.7 | 15.1 | 13.5 |
| 2019 | 20.6 | 17.7 | 13.5 |
| 2020 | 20.3 | 15.0 | 12.5 |
| 2021 | 19.1 | 17.1 | 13.4 |
| Average | 20.6 | 16.3 | 13.1 |
Yes, 2021 saw the second-lowest opportunities per game for RB1s in this 10-year stretch, but we've seen that number dip even lower in 2015 before spiking back up for a few years.
Overall, though, the RB1's collective workload is trending down a little while the RB2 and RB3 workloads are more stable.
Is this enough to lead to a real shift in the efficacy of waiver-wire backs? After all, if RB1s are weaker, then that closes the gap between them and the rest of the position.
Right?
The Process and Goals of the Study
I'll keep this part tight: I pulled weekly waiver-wire addition numbers from FleaFlicker to see which running backs were added at the highest rate in a single week throughout a given season.
From there, I'll look at how these backs fared before and after being added to see what we were actually getting from these top-level waiver-wire pickups and whether it can match high-end fantasy running back output, given the reduced roles of the elite running backs as a whole.
2021 in Review
While the scope of this piece is larger than just last season, I find it helpful and illuminating to take an actual look back at how things can play out -- and actually have played out.
It can really help to see tangible examples for a topic as tenuous as this.
The running back added most often in a single week in 2021 was Elijah Mitchell of the San Francisco 49ers entering Week 2 after the 49ers' starting running back, Raheem Mostert, got injured in the opener.
Mitchell ultimately finished the season as the RB25 in half-PPR formats. On a per-game basis, he was the RB19.
So, this was an absolute win for those who added Mitchell, wasn't it? They secured an RB2-caliber option from Week 2 onward -- all for the top FAAB bid or waiver claim, right?
Yes, but it didn't work that way exactly, and it's important to remember that when our goal is fantasy football success.
Mitchell racked up 17 rushes for 42 yards and 2 catches for 11 yards in Week 2 but wound up with a shoulder injury that sidelined him until Week 5.
So, after picking him up entering Week 2, Mitchell gave you an RB37 showing and followed it up with two straight missed games. In Week 5, he was the RB39 and then hit a bye week in Week 6.
Here's how that looks in graphic form -- as well as the other top-30 single-week additions in 2021. (Top-12 weeks are highlighted in green; top-24 are in yellow, and those outside the top-36 are in red.)
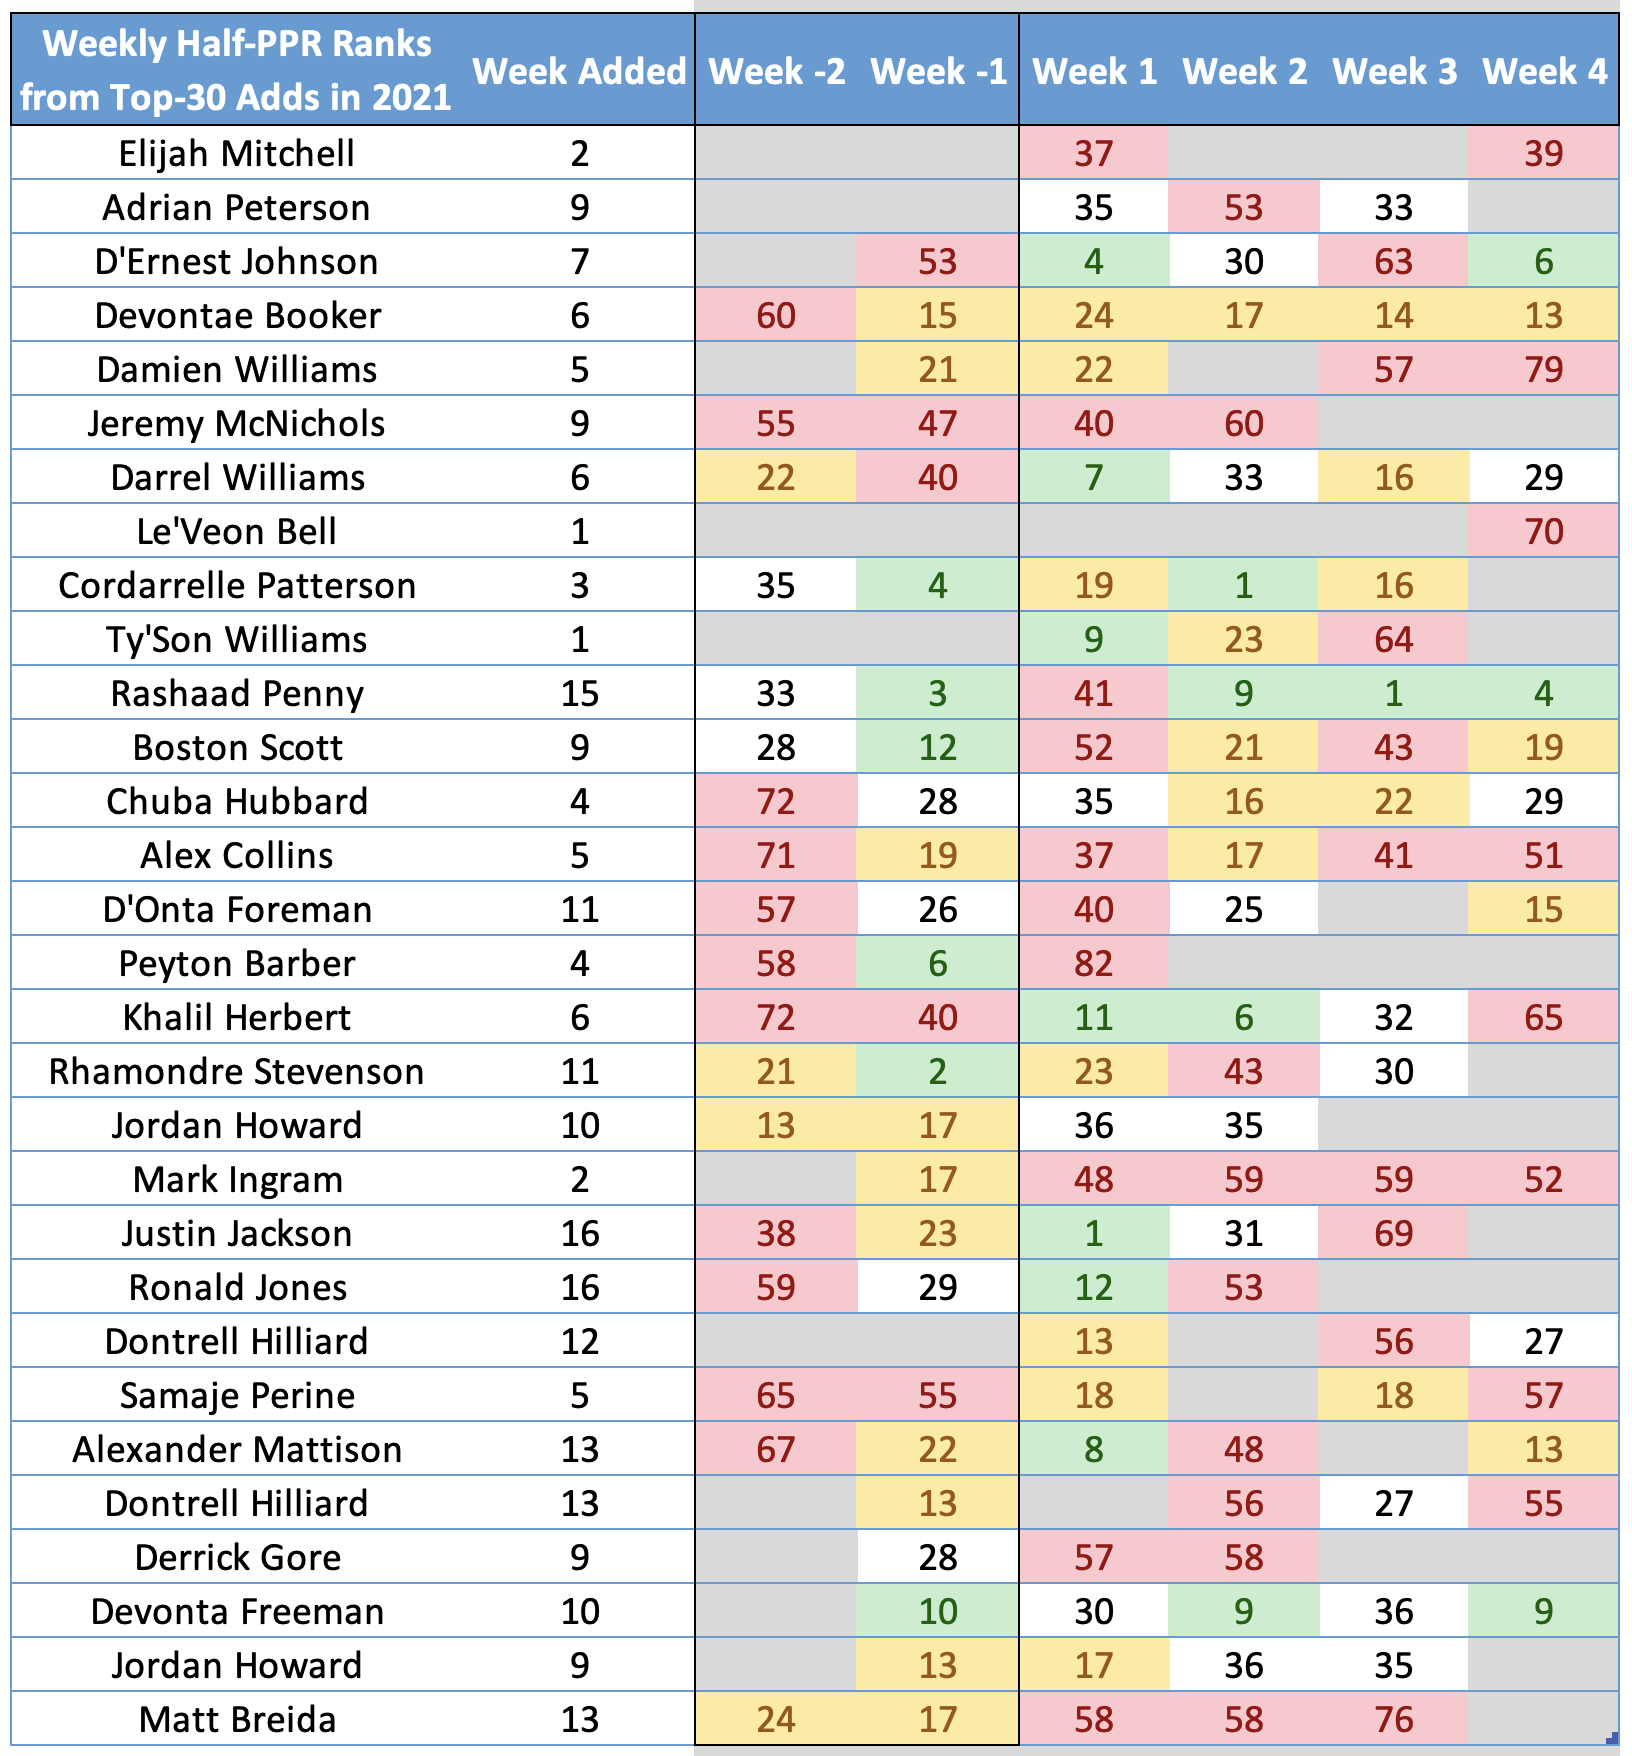
Despite a great overall season, Mitchell didn't give us a top-24 outing until Week 7. From then on, great stuff. Was that a home run pickup starting in Week 2? Again, it depends on your expectations.
What about some other names on this list?
Adrian Peterson was added big-time when he signed with the Tennessee Titans to help fill the void of Derrick Henry. He didn't really help fantasy teams.
D'Ernest Johnson gave us the RB4 showing in Week 7 with Nick Chubb out and Kareem Hunt on injured reserve. He had two more top-10 weeks (Week 10 and Week 18). In Week 10, he once again played without Chubb and Hunt.
Johnson was the fourth-most added running back entering Week 10, suggesting a lot of managers cut ties with him after Week 7. In most leagues, his Week 18 outing was irrelevant.
Devontae Booker is probably the best, most realistic example of what you're hoping for from a waiver-wire back: he had four straight top-24 weeks after being added heavily after Saquon Barkley sustained an ankle injury. He gave us instant, consistent production for a while. Barkley managers struggled, and managers who acquired Booker benefitted.
I don't want to prop up a straw man, but it feels like this -- the Booker situation -- is what the expectations are for waiver-wire backs, that these types of obvious, instant additions grow on trees because of the injury rate at running back. It's not really the case across a decade of waiver-wire additions.
So, anyway, yeah, there are hits among these top guys -- especially with a few instant RB1 weeks -- but there are big misses, too, if the goal is to find reliable producers for our fantasy teams.
Now, let me stop here.
On behalf of those who espouse the ZeroRB philosophy, even these "misses" or "modest hits" are categorical wins for their case. The fact that early-drafted backs in Henry, Chubb, Barkley, and Mostert got hurt and missed time helps their teams.
Why? Because most of the ZeroRB teams wouldn't have invested in them. Thus, by having other teams ailing, their teams benefit indirectly -- all while giving them the chance to acquire the backups in question.
But let's now scale this back to 2017 to get five seasons of the top 30 adds at running back. These are the top two additions, on average, per week.
Why the top 30? I'm trying to find a balance between the reality of the waiver wire. There are rarely three or more backs we'd want to add in a given week, but I also don't want to focus solely on the smaller handful of standout options from the wire, either. Besides, you can look directly at the top of the graphic above. The top-10 or so don't look that different from the bottom-20 or so. It's a mixed bag on the wire.
So, here is the breakdown of how often these top-30 yearly additions hit particular thresholds by weekly fantasy point rankings in half-PPR setups. (These rates ignore games during which a back did not accrue a single touch, so games missed for their own injuries, for example, are forgiven.)
| Weekly RB Rank Rate | Week -1 | Week 1 | Week 2 | Week 3 | Week 4 |
|---|---|---|---|---|---|
| RB1 - RB12 | 40.6% | 25.2% | 17.6% | 16.4% | 15.2% |
| RB13 - RB24 | 28.6% | 23.1% | 16.0% | 19.1% | 19.0% |
| RB25 - RB36 | 15.8% | 16.8% | 24.4% | 23.6% | 24.8% |
| RB37 or Worse | 15.0% | 35.0% | 42.0% | 40.9% | 41.0% |
Okay, so we see that these top-30 additions are top-12 fantasy backs (i.e. RB1 to RB12) at a 40.6% clip in games before being added. Simply: a lot of these guys did something the week before getting added to a lot of rosters, whether that was taking over after an injury to the starter or separating from a committee in a particular game. We often chase that result.
That RB1 rate, however, drops to 25.2% after we actually add these players and can start them, so they're substantially less likely to repeat as top-12 performers.
Still, combined, there's a 48.3% chance that these top-30 pickups gave you an RB2 or better performance (i.e. rank inside the top 24 for the week) the week after they were added heavily. That's not nothing, and it bests the 35.0% chance that they are the RB36 or worse.
The numbers dip week to week from there.
Within this information, there's good (we can get RB2 performances fairly often) and bad (there's still a high bust rate, and we're generally adding these players after big games).
The high-end rates are actually a bit weaker than we saw the last time I dug into this. But we do see a higher probability of backs giving us RB3-level performance in the past five years compared to the eight seasons from 2010 to 2017.
This shows the change in weekly results we have been getting from waiver-wire running backs since 2018 compared to the eight prior seasons I studied.
| 2018-2022 Sample vs. 2010-2017 Sample |
Week -1 | Week 1 | Week 2 | Week 3 | Week 4 |
|---|---|---|---|---|---|
| RB1 - RB12 | -2.8% | 0.7% | 0.0% | -7.6% | -1.0% |
| RB13 - RB24 | 15.4% | -2.6% | -3.9% | -1.6% | -9.0% |
| RB25 - RB36 | -4.1% | 2.5% | 4.5% | 8.8% | 13.4% |
| RB37 or Worse | -8.4% | -0.5% | -0.5% | 0.4% | -3.6% |
To simplify it all, we are getting fewer RB1s and are settling for more RB3s from these waiver-wire backs in recent seasons.
What is the cause for the decline?
It's workload related.
If timeshares hurt stud backs and improved the efficacy of replacement-level backs (i.e. those we're adding from the waiver wire), we should see a better rate of waiver backs making a difference.
What we are seeing is a steady drop in opportunities per game after being added to rosters for this waiver-wire sample.
| Average Opportunities (Carries + Targets) Per Game |
Week -1 | Week 1 | Week 2 | Week 3 | Week 4 |
|---|---|---|---|---|---|
| Top-30 Waiver-Wire Additions | 15.1 | 14.7 | 13.1 | 12.7 | 12.3 |
Recall the averages posted in the first table in this article: RB1s average 20.6 chances per game, RB2s are at 16.3, and RB3s are at 13.1. These waiver backs are stepping into RB3 workloads on average.
And if they're playing behind a feature back to begin with, then it's probably safe to question their ability to produce RB1 numbers (spare me the Tony Pollard anecdotes) on RB3-level opportunities.
Yes, fewer backs per season are seeing elevated opportunities compared to history, but at the same time, replacement backs are suffering from that, too.
What Are Early-Round Running Backs Producing Lately?
A lot of this still centers on the production and efficiency we get from early-round running backs.
Since 2018, we've had 48 top-12 running backs by average draft position (taken from MyFantasyLeague).
Of those, 29 (60.4%) finished as top-12 running backs for the full season. An additional six (12.5%) were top-24 performers. Essentially, that means 72.9% of early-drafted backs were viable in a weekly starting lineup.
Six of these backs finished outside the top-40 in full-season half-PPR fantasy points, and of those backs who totally busted, injuries were a huge culprit: none of them played more than eight games.
But let's go back to that initial 60.4% rate. That would still lead to around a 40% mark of top-12 backs who weren't inside the top dozen at the position in ADP.
Who are those fellas? Where can we find them?
Still early in the draft.
Four had top-15 ADPs, 12 were in the top-30 in ADP, and only one (James Conner, the RB58 in 2018 -- when Le'Veon Bell sat out the season) was outside the top 50.
We still see a majority of elite seasons coming from early-round picks -- specifically first- and second-rounders. And waiver-wire running backs aren't overtaking this sample any time soon.
What It All Means for 2022 and Beyond
I love gaining an edge in fantasy football no matter what it means. If the best leverage play available was to draft a defense in the first round, I'd do it, but it's not. We know that.
That being said, the departure away from featured running backs in the NFL is both a bit overstated and not altering the fantasy football running back landscape from what we saw years ago.
League-altering upside still comes primarily (i.e. almost exclusively) from the top of the draft, and even the best waiver-wire backs are generally replacing RB3s and FLEX options on our teams -- not true RB1s.
Let the overarching takeaways be these:
- You can build around other positions and find replacement-level running back options on the waiver wire. You'll benefit when other teams' backs miss time, but history suggests that you aren't getting elite running back production from the wire -- even in today's running back climate.
- Building around running backs in drafts can derail a season if your picks get hurt, but the reward of elite RB seasons remains unmatched by waiver-wire options or even backs taken later in drafts.
- We are a long, long way away from elite, early-round fantasy football RBs being a thing of the past.


